Goldman Sachs Investment Banking Pitch Book
Goldman
Sachs
Discounted Cash Flow Analysis - Sensitivities INVESTMENT BANKING
DIVISION
($ in millions)
Assumptions
Exit NTM (¹27E) P/E
Multiple: 9.0x
Discount Rate: 9.875%
Assumptions
Exit NTM (27E) P/E
Multiple: 9.0x
Discount Rate: 9.875%
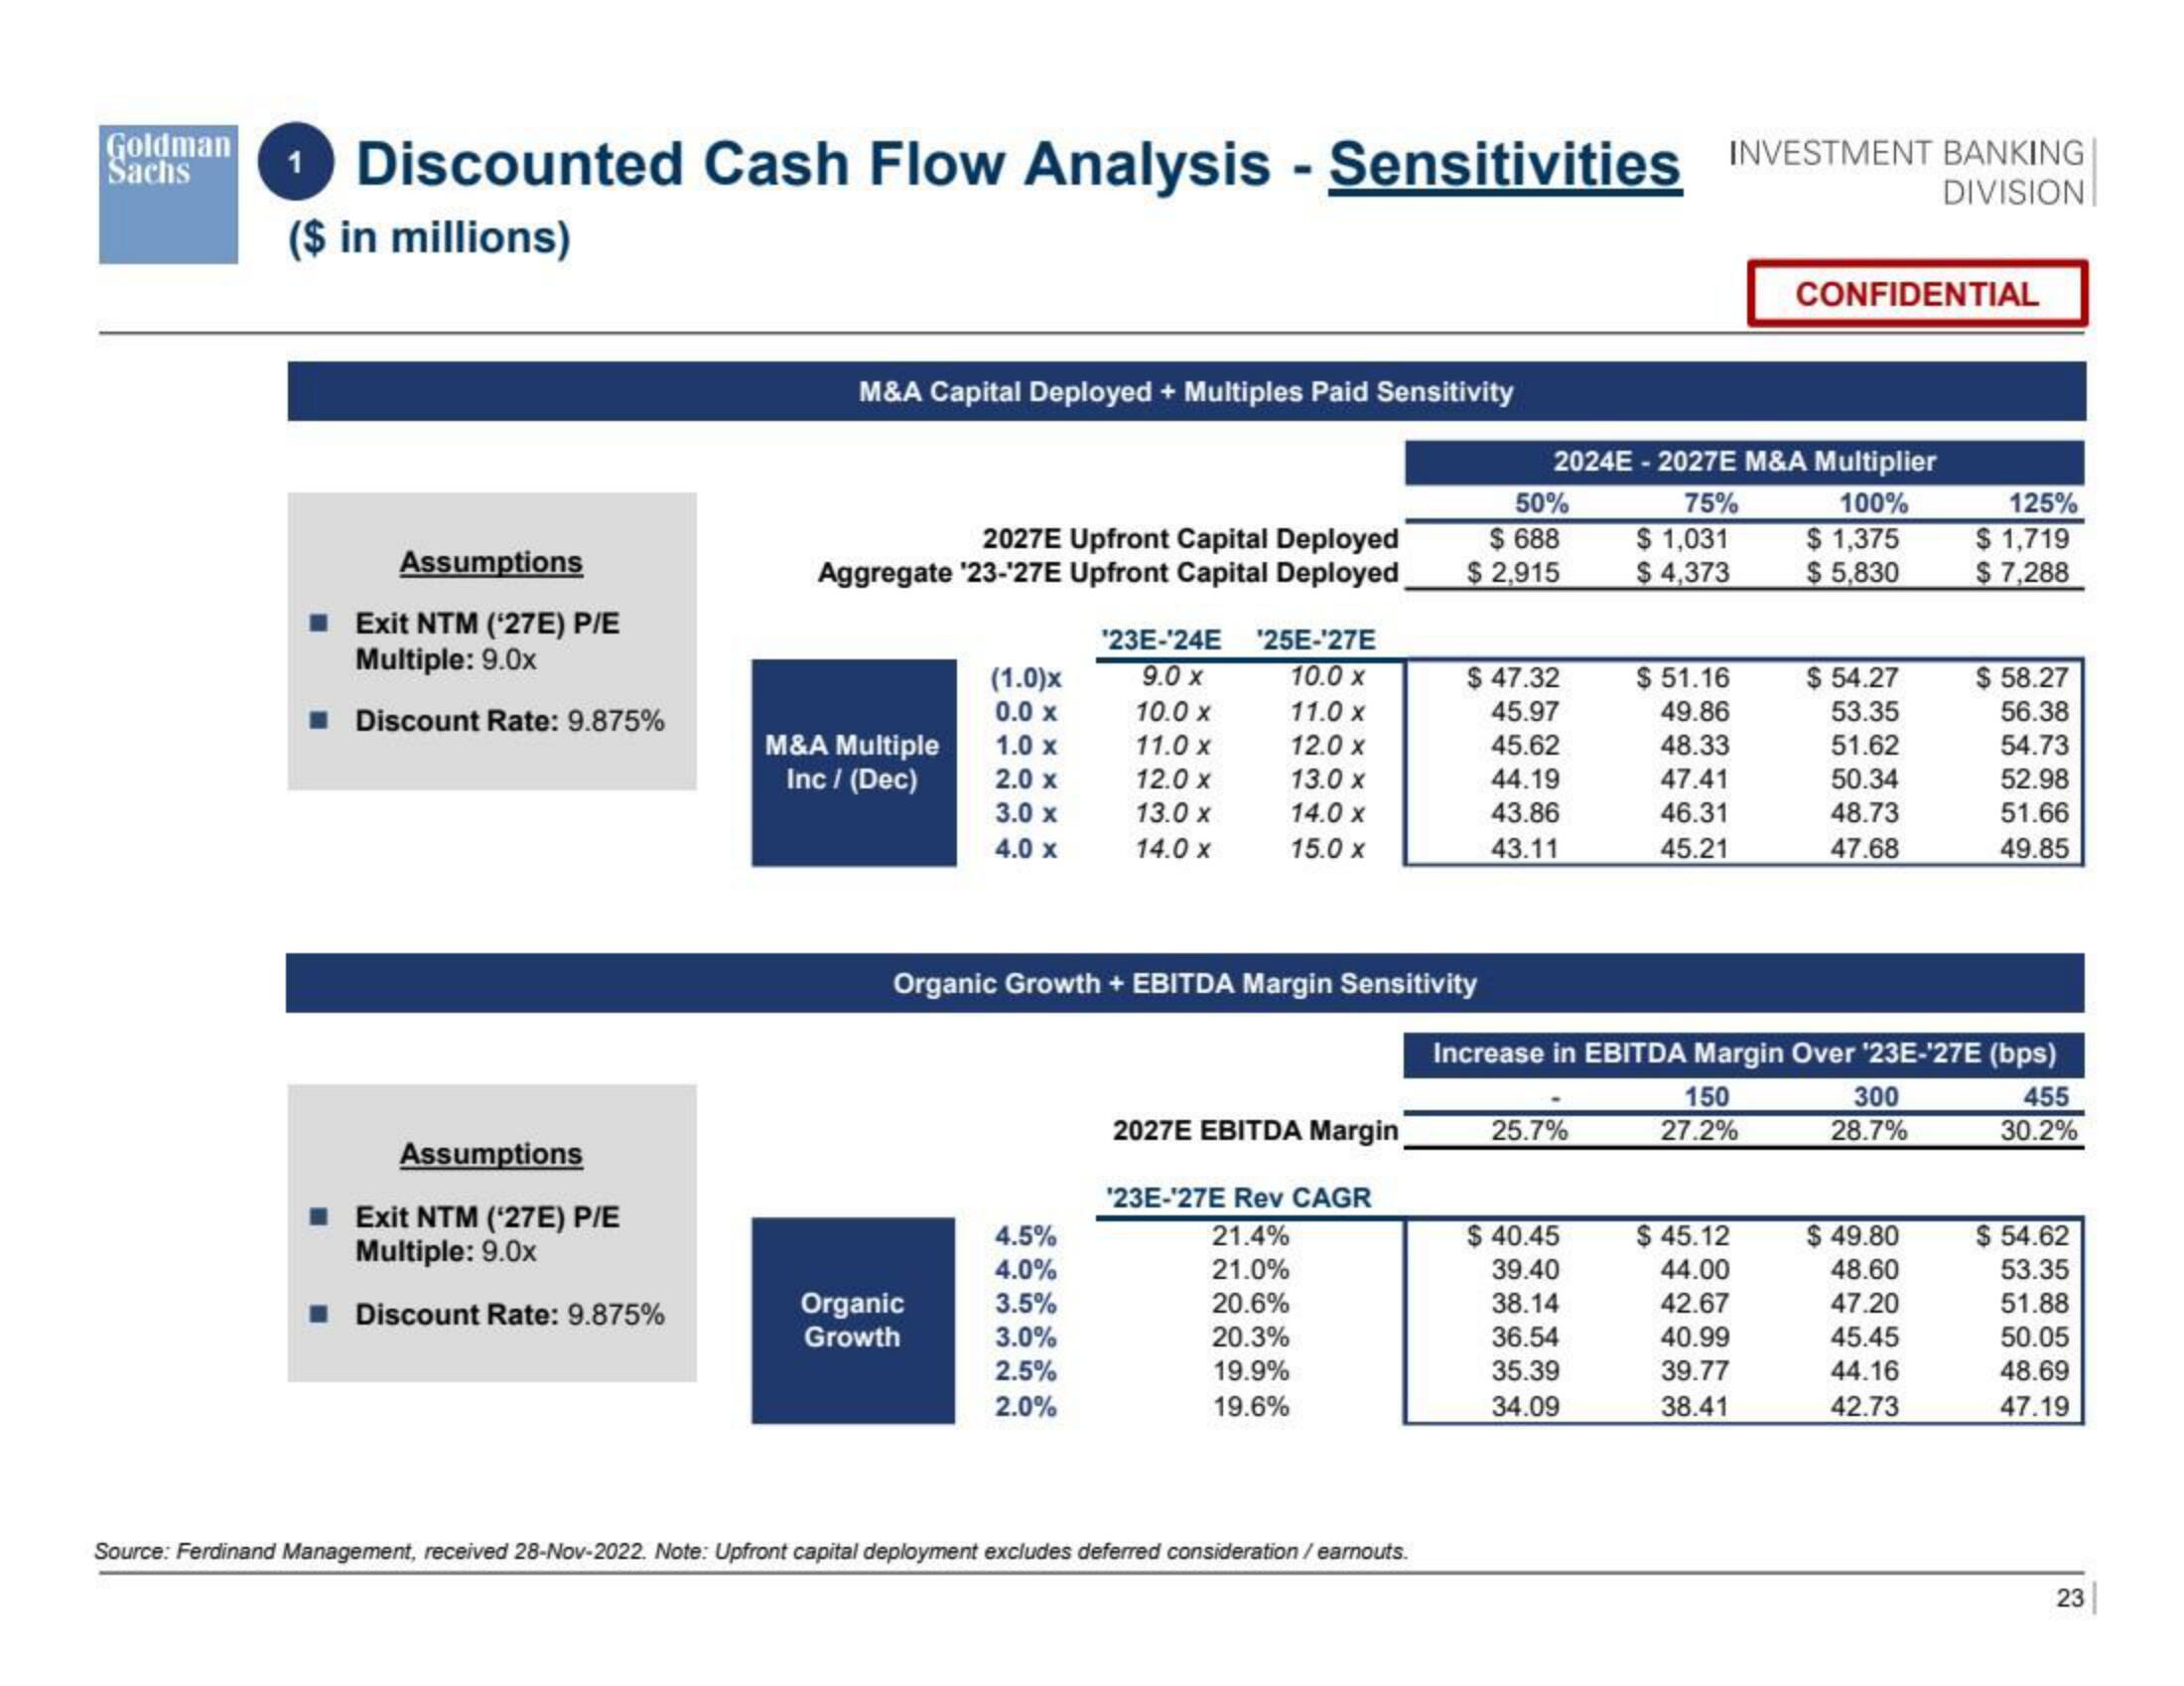
M&A Capital Deployed + Multiples Paid Sensitivity
2027E Upfront Capital Deployed
Aggregate '23-¹27E Upfront Capital Deployed
M&A Multiple
Inc / (Dec)
(1.0)x
0.0 x
1.0 x
2.0 x
3.0 x
4.0 x
Organic
Growth
'23E-¹24E '25E-'27E
9.0 x
10.0 X
10.0 X
11.0 x
11.0 x
12.0 X
13.0 x
14.0 X
15.0 x
4.5%
4.0%
3.5%
3.0%
2.5%
2.0%
12.0 x
13.0 x
14.0 X
Organic Growth + EBITDA Margin Sensitivity
2027E EBITDA Margin
'23E-¹27E Rev CAGR
21.4%
21.0%
20.6%
20.3%
19.9%
19.6%
Source: Ferdinand Management, received 28-Nov-2022. Note: Upfront capital deployment excludes deferred consideration / earnouts.
2024E-2027E M&A Multiplier
100%
$ 1,375
$5,830
50%
$ 688
$ 2,915
$ 47.32
45.97
45.62
44.19
43.86
43.11
25.7%
75%
$ 1,031
$4,373
$40.45
39.40
38.14
36.54
35.39
34.09
$51.16
49.86
48.33
47.41
46.31
45.21
CONFIDENTIAL
150
27.2%
$ 45.12
44.00
42.67
40.99
39.77
38.41
$ 54.27
53.35
51.62
50.34
48.73
47.68
Increase in EBITDA Margin Over ¹23E-¹27E (bps)
455
30.2%
300
28.7%
125%
$ 1,719
$7,288
$ 49.80
48.60
47.20
45.45
44.16
42.73
$ 58.27
56.38
54.73
52.98
51.66
49.85
$ 54.62
53.35
51.88
50.05
48.69
47.19
23View entire presentation