Corecentric Investor Presentation Deck
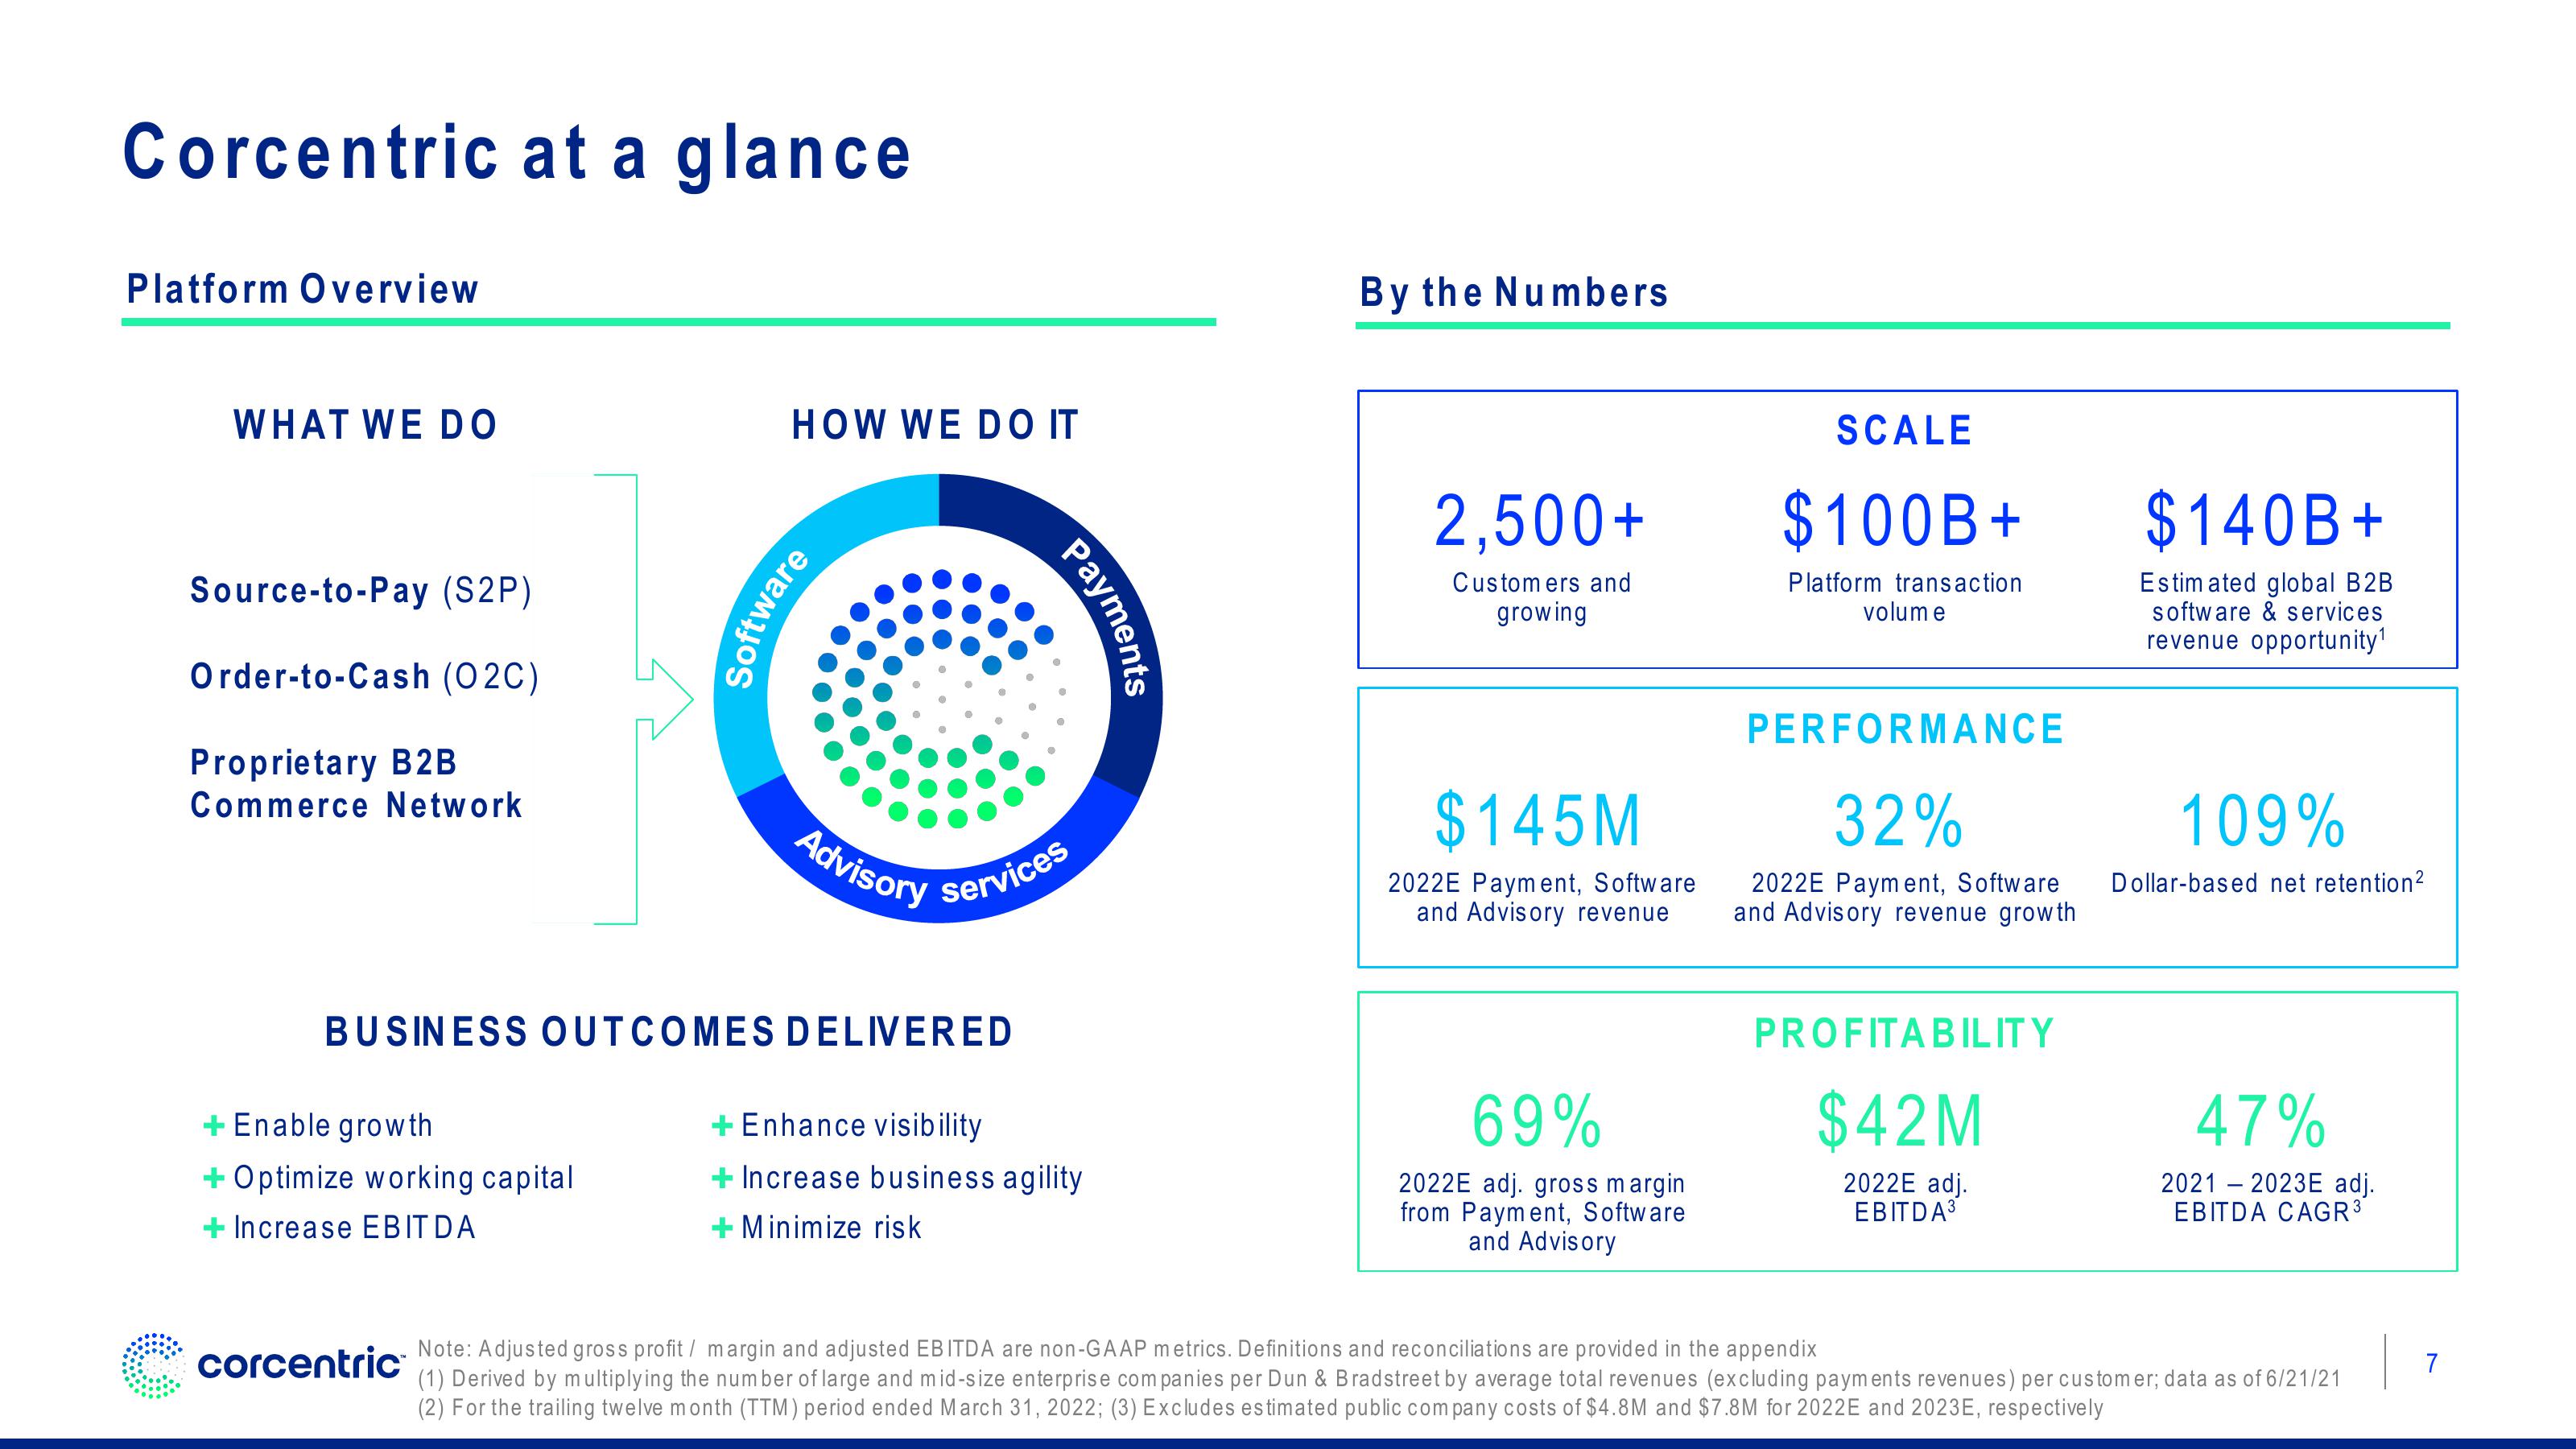
Corcentric at a glance
Platform Overview
WHAT WE DO
Source-to-Pay (S2P)
Order-to-Cash (02C)
Proprietary B2B
Commerce Network.
+ Enable growth
Optimize working capital
Increase EBITDA
HOW WE DO IT
corcentric
Software
Advisory
BUSINESS OUTCOMES DELIVERED
Payments
services
+ Enhance visibility
+ Increase business agility
Minimize risk
By the Numbers
2,500+
Customers and
growing
$145M
2022E Payment, Software
and Advisory revenue
69%
2022E adj. gross margin
from Payment, Software
and Advisory
SCALE
$100B +
Platform transaction
volum e
PERFORMANCE
32%
2022E Payment, Software
and Advisory revenue growth
PROFITABILITY
$42M
2022E adj.
EBITDA³
$140B +
Estimated global B2B
software & services
revenue opportunity¹
109%
Dollar-based net retention²
47%
2021 2023E adj.
EBITDA CAGR ³
Note: Adjusted gross profit / margin and adjusted EBITDA are non-GAAP metrics. Definitions and reconciliations are provided in the appendix
(1) Derived by multiplying the number of large and mid-size enterprise companies per Dun & Bradstreet by average total revenues (excluding payments revenues) per customer; data as of 6/21/21
(2) For the trailing twelve month (TTM) period ended March 31, 2022; (3) Excludes estimated public company costs of $4.8M and $7.8M for 2022E and 2023E, respectively
7View entire presentation