ILPT Q2 2023 Financial Results
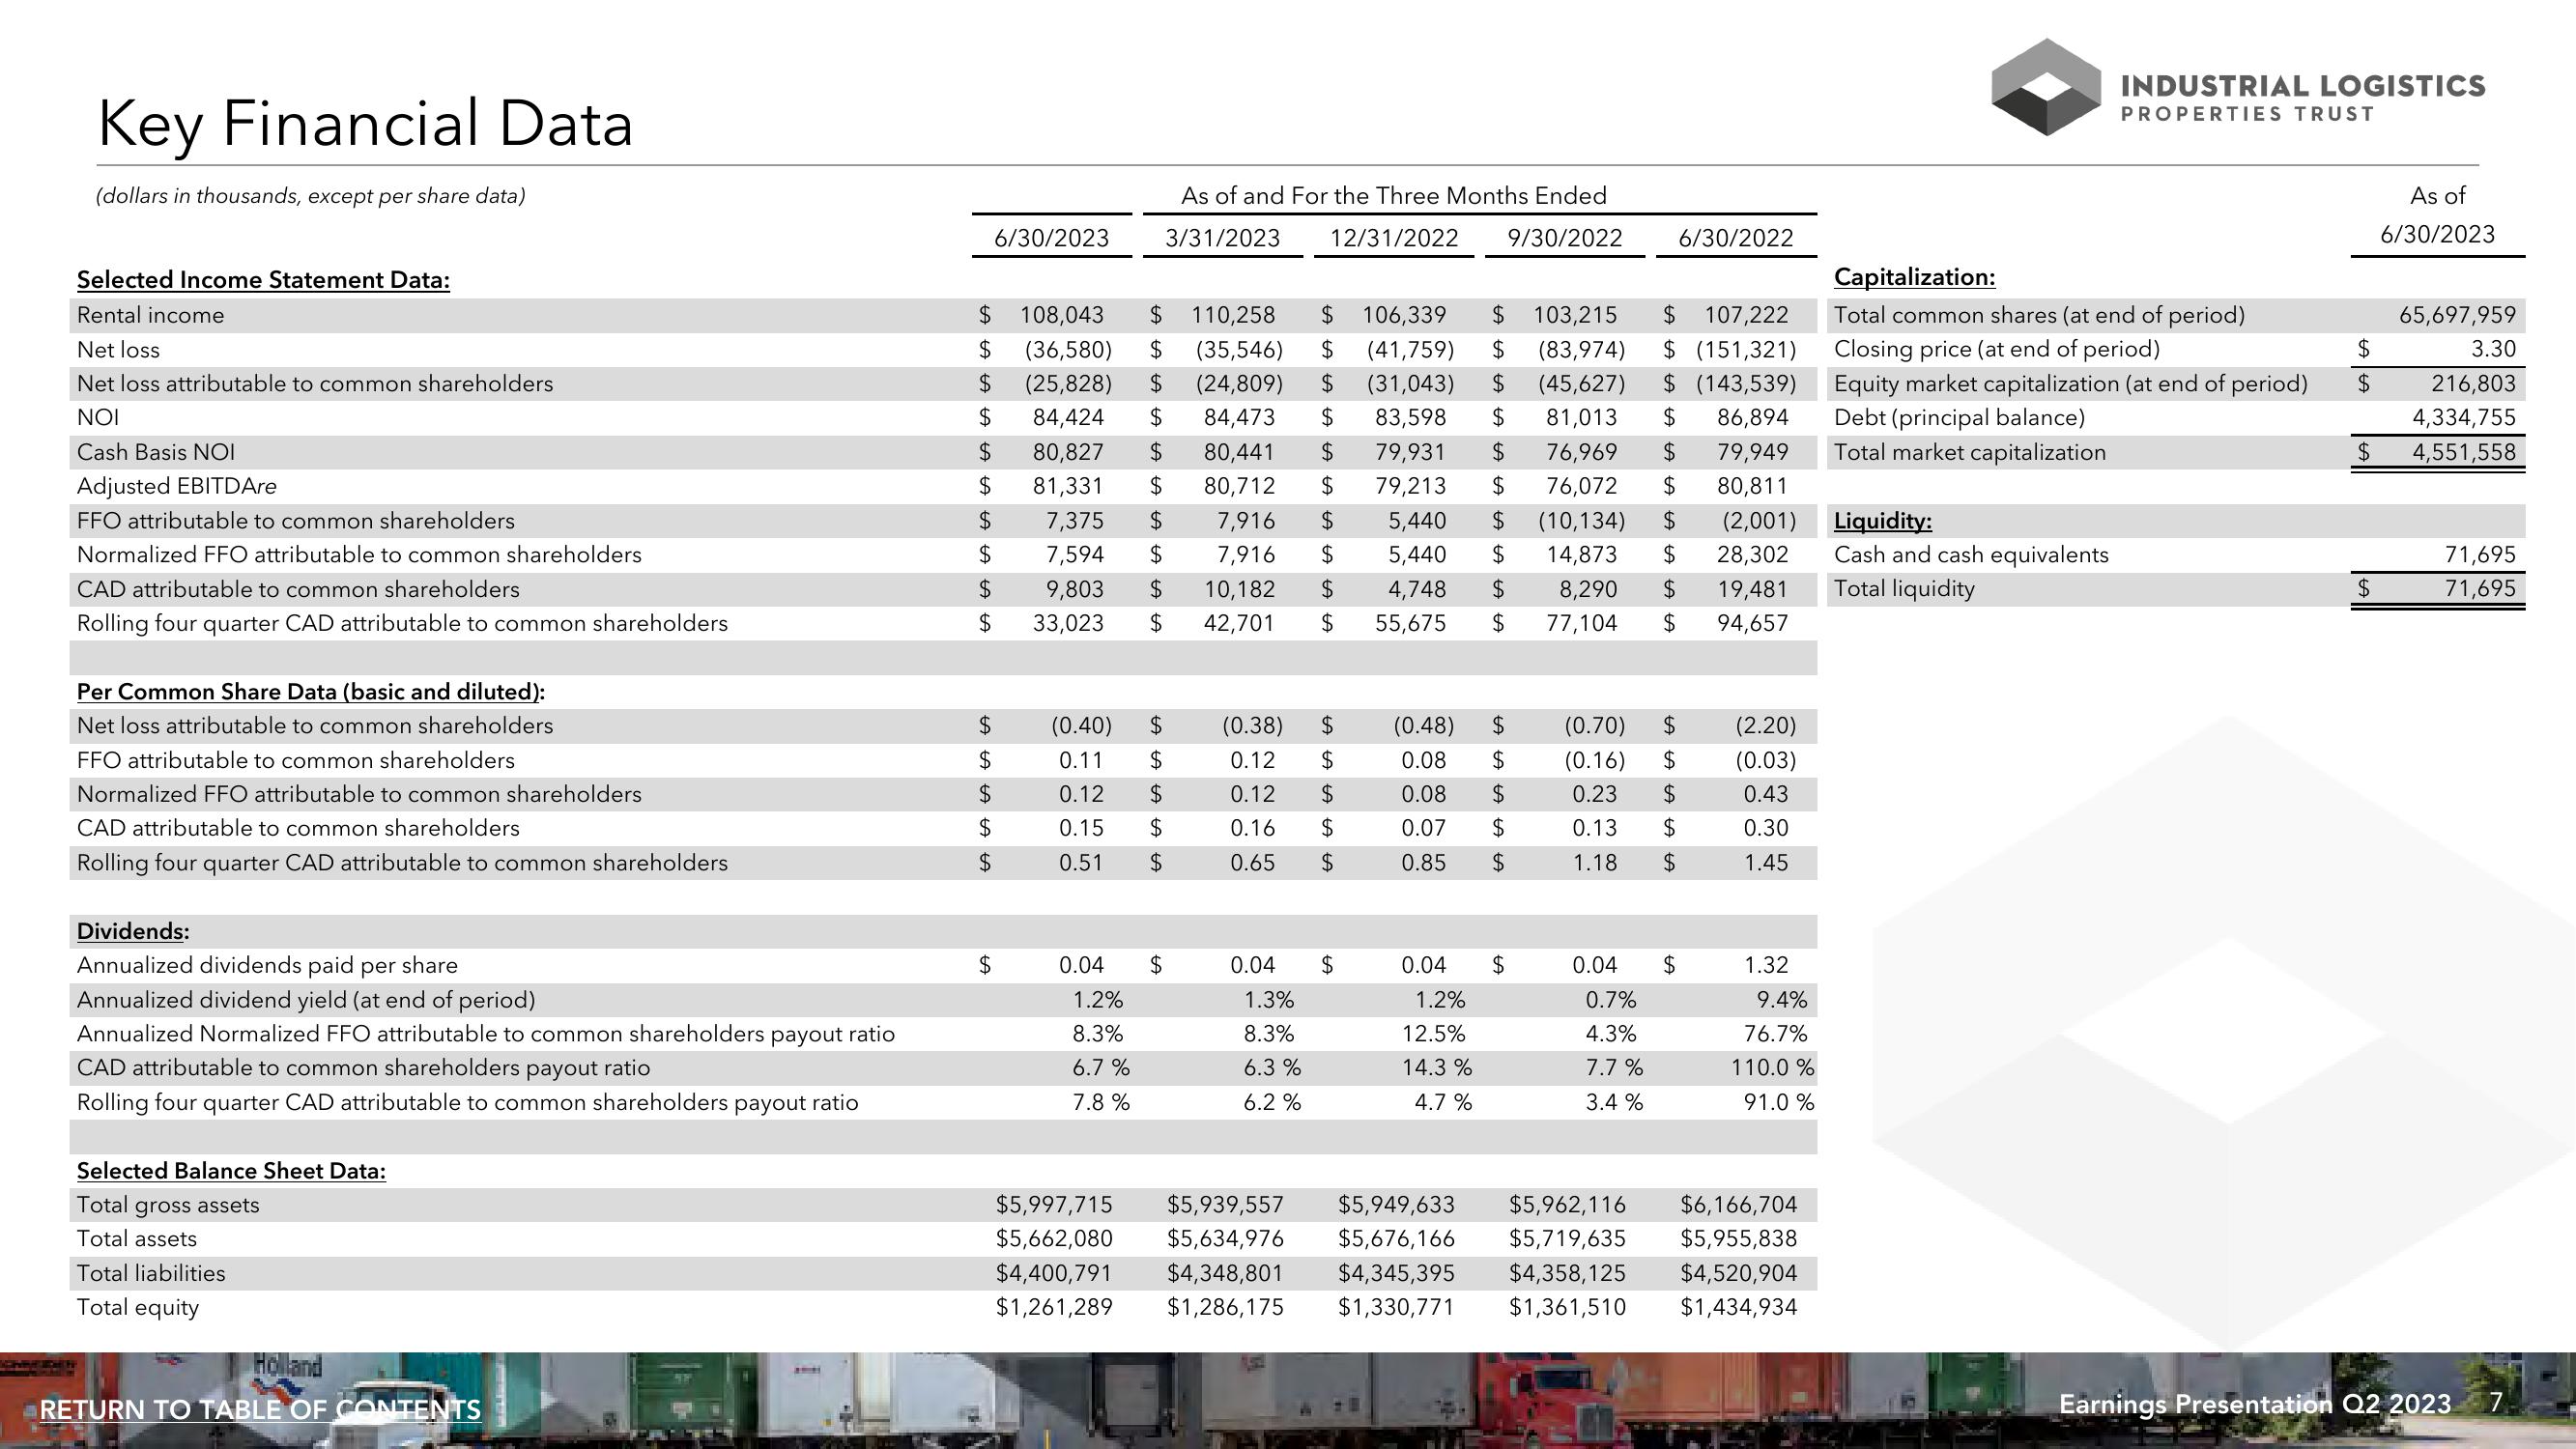
Key Financial Data
(dollars in thousands, except per share data)
Selected Income Statement Data:
Rental income
Net loss
Net loss attributable to common shareholders
NOI
Cash Basis NOI
Adjusted EBITDAre
FFO attributable to common shareholders
Normalized FFO attributable to common shareholders
CAD attributable to common shareholders
Rolling four quarter CAD attributable to common shareholders
Per Common Share Data (basic and diluted):
Net loss attributable to common shareholders
FFO attributable to common shareholders
Normalized FFO attributable to common shareholders
CAD attributable to common shareholders
Rolling four quarter CAD attributable to common shareholders
Dividends:
Annualized dividends paid per share
Annualized dividend yield (at end of period)
Annualized Normalized FFO attributable to common shareholders payout ratio
CAD attributable to common shareholders payout ratio
Rolling four quarter CAD attributable to common shareholders payout ratio
Selected Balance Sheet Data:
Total gross assets
Total assets
Total liabilities
Total equity
Holland
RETURN TO TABLE OF CONTENTS
LA LA LA LA
$ 108,043
LA LA LA LA LA LA
$
$
$ (36,580)
$ (25,828)
$ 84,424 $
$ 80,827 $
$ 81,331 $
$ 7,375 $
7,594 $
9,803
33,023
$
LA LA LA LA LA
$
$
$
$
$
6/30/2023
LA
$
$
0.04
1.2%
8.3%
6.7 %
7.8%
$
110,258 $ 106,339 $ 103,215 $ 107,222
(35,546) $ (41,759) $ (83,974) $ (151,321)
$ (24,809) $ (31,043) $ (45,627) $ (143,539)
84,473 $ 83,598 $ 81,013 $ 86,894
80,441 $ 79,931 $ 76,969 $ 79,949
80,712 $ 79,213 $ 76,072 $ 80,811
7,916 $ 5,440 $ (10,134) $ (2,001)
7,916 $ 5,440 $ 14,873 $ 28,302
$ 10,182 $ 4,748 $ 8,290 $ 19,481
42,701 $ 55,675 $ 77,104 $ 94,657
$
LA LA LA
+A
LA LA
LA LA
(0.40) $
0.11 $
0.12 $
0.15 $
$
0.51
LA
As of and For the Three Months Ended
3/31/2023
12/31/2022 9/30/2022
$
(0.38) $
0.12 $
0.12 $
0.16 $
0.65 $
0.04
1.3%
8.3%
LA LA LA
6.3 %
6.2 %
$
LA LA
(0.48) $
0.08 $
0.08 $
0.07 $
0.85 $
0.04 $
1.2%
12.5%
14.3%
4.7%
(0.70) $
(0.16) $
0.23
$
0.13 $
1.18 $
6/30/2022
0.04 $
0.7%
4.3%
7.7 %
3.4 %
(2.20)
(0.03)
0.43
0.30
1.45
1.32
9.4%
76.7%
110.0 %
91.0 %
$5,949,633
$5,962,116
$5,997,715 $5,939,557
$6,166,704
$5,662,080 $5,634,976 $5,676,166 $5,719,635 $5,955,838
$4,400,791 $4,348,801 $4,345,395 $4,358,125 $4,520,904
$1,261,289 $1,286,175 $1,330,771 $1,361,510
$1,434,934
INDUSTRIAL LOGISTICS
PROPERTIES TRUST
Capitalization:
Total common shares (at end of period)
Closing price (at end of period)
Equity market capitalization (at end of period)
Debt (principal balance)
Total market capitalization
Liquidity:
Cash and cash equivalents
Total liquidity
$
$
$
$
As of
6/30/2023
65,697,959
3.30
216,803
4,334,755
4,551,558
71,695
71,695
Earnings Presentation Q2 2023View entire presentation