Experian ESG Presentation Deck
Executive Summary
Improving Financial Health
54
Environment - carbon emissions data
Data
Scope 1 and 2 emissions
Scope 1 emissions
Scope 2 emissions (market based)
Total Scope 1 and 2 emissions
Scope 3 emissions
Purchased goods and services¹
Fuel-and-energy-related activities ¹
Business travel¹
Upstream leased assets
Capital goods
Employee commuting
Investments
Total
Total Scope 1, 2 and 3 emissions
O Experian Public
Employees
Waste generated in operations
Total Scope 3
Subset of emissions within our Scope 3 science-based target (Purchased Goods and
Services, Business Travel, and Fuel-and-energy-related activities)
Supply Chain
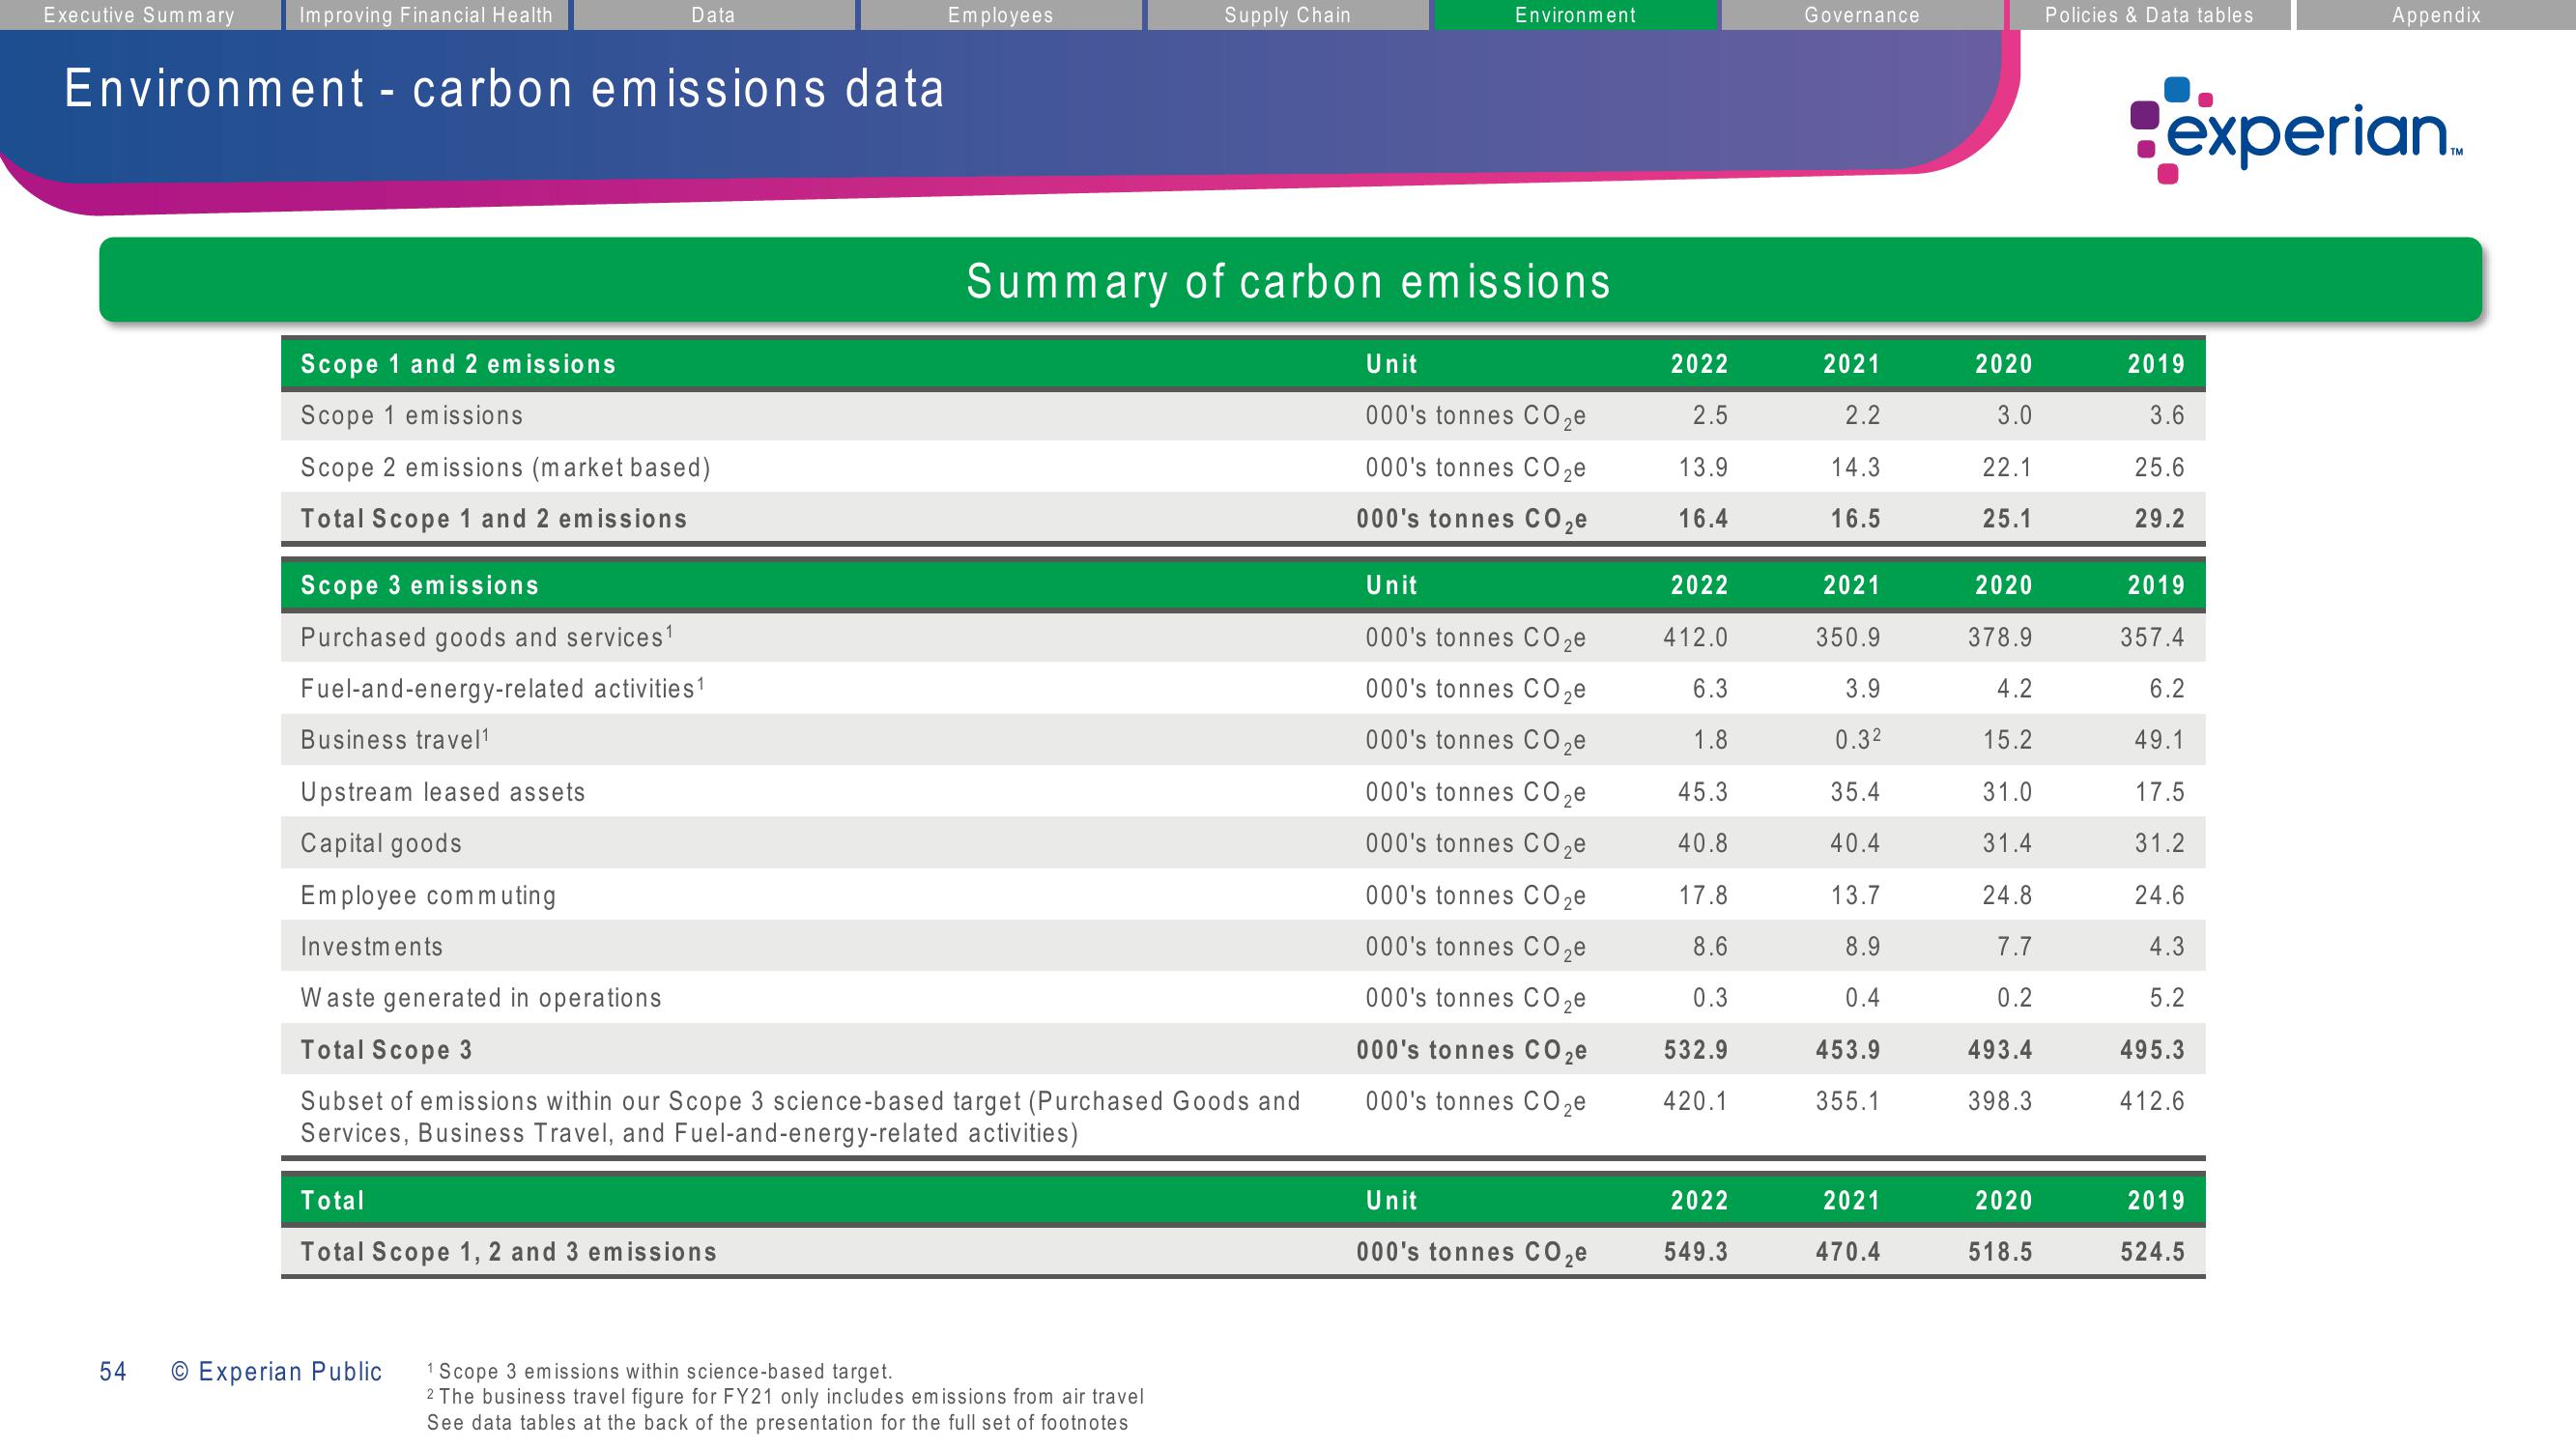
Summary of carbon emissions
1 Scope 3 emissions within science-based target.
2 The business travel figure for FY21 only includes emissions from air travel
See data tables at the back of the presentation for the full set of footnotes
Environment
Unit
000's tonnes CO₂e
000's tonnes CO₂e
000's tonnes CO₂e
Unit
000's tonnes CO₂e
000's tonnes CO₂e
000's tonnes CO₂e
000's tonnes CO₂e
000's tonnes CO ₂e
000's tonnes CO₂e
000's tonnes CO₂e
000's tonnes CO₂e
000's tonnes CO₂e
000's tonnes CO ₂e
Unit
000's tonnes CO₂e
2022
2.5
13.9
16.4
2022
412.0
6.3
1.8
45.3
40.8
17.8
8.6
0.3
532.9
420.1
2022
549.3
Governance
2021
2.2
14.3
16.5
2021
350.9
3.9
0.3²
35.4
40.4
13.7
8.9
0.4
453.9
355.1
2021
470.4
2020
3.0
22.1
25.1
2020
378.9
4.2
15.2
31.0
31.4
24.8
7.7
0.2
493.4
398.3
2020
518.5
Policies & Data tables
experian.
2019
3.6
25.6
29.2
2019
357.4
6.2
49.1
17.5
31.2
24.6
4.3
5.2
495.3
412.6
Appendix
2019
524.5View entire presentation