EVBox SPAC Presentation Deck
Consolidated Financial Projections
€ in Millions
Total Revenue
2020
EBITDA - Capex
2021
€70
% YoY Growth
Gross Profit
€17
€38
Gross Margin %
24%
32%
H
Total Operating Expenses (¹)
€118
Adjusted EBITDA
(€80)
EBITDA Margin %
(66%)
Capital Expenditures (1.2)
€120
72%
€26
(€106)
2022
TPG PACE BENEFICIAL FINANCE CORP.
€225
87%
€82
37%
€127
(€45)
(20%)
€14
(€59)
2023
€372
65%
€140
38%
€138
€2
1%
€17
(€15)
EVBOX
GROUP
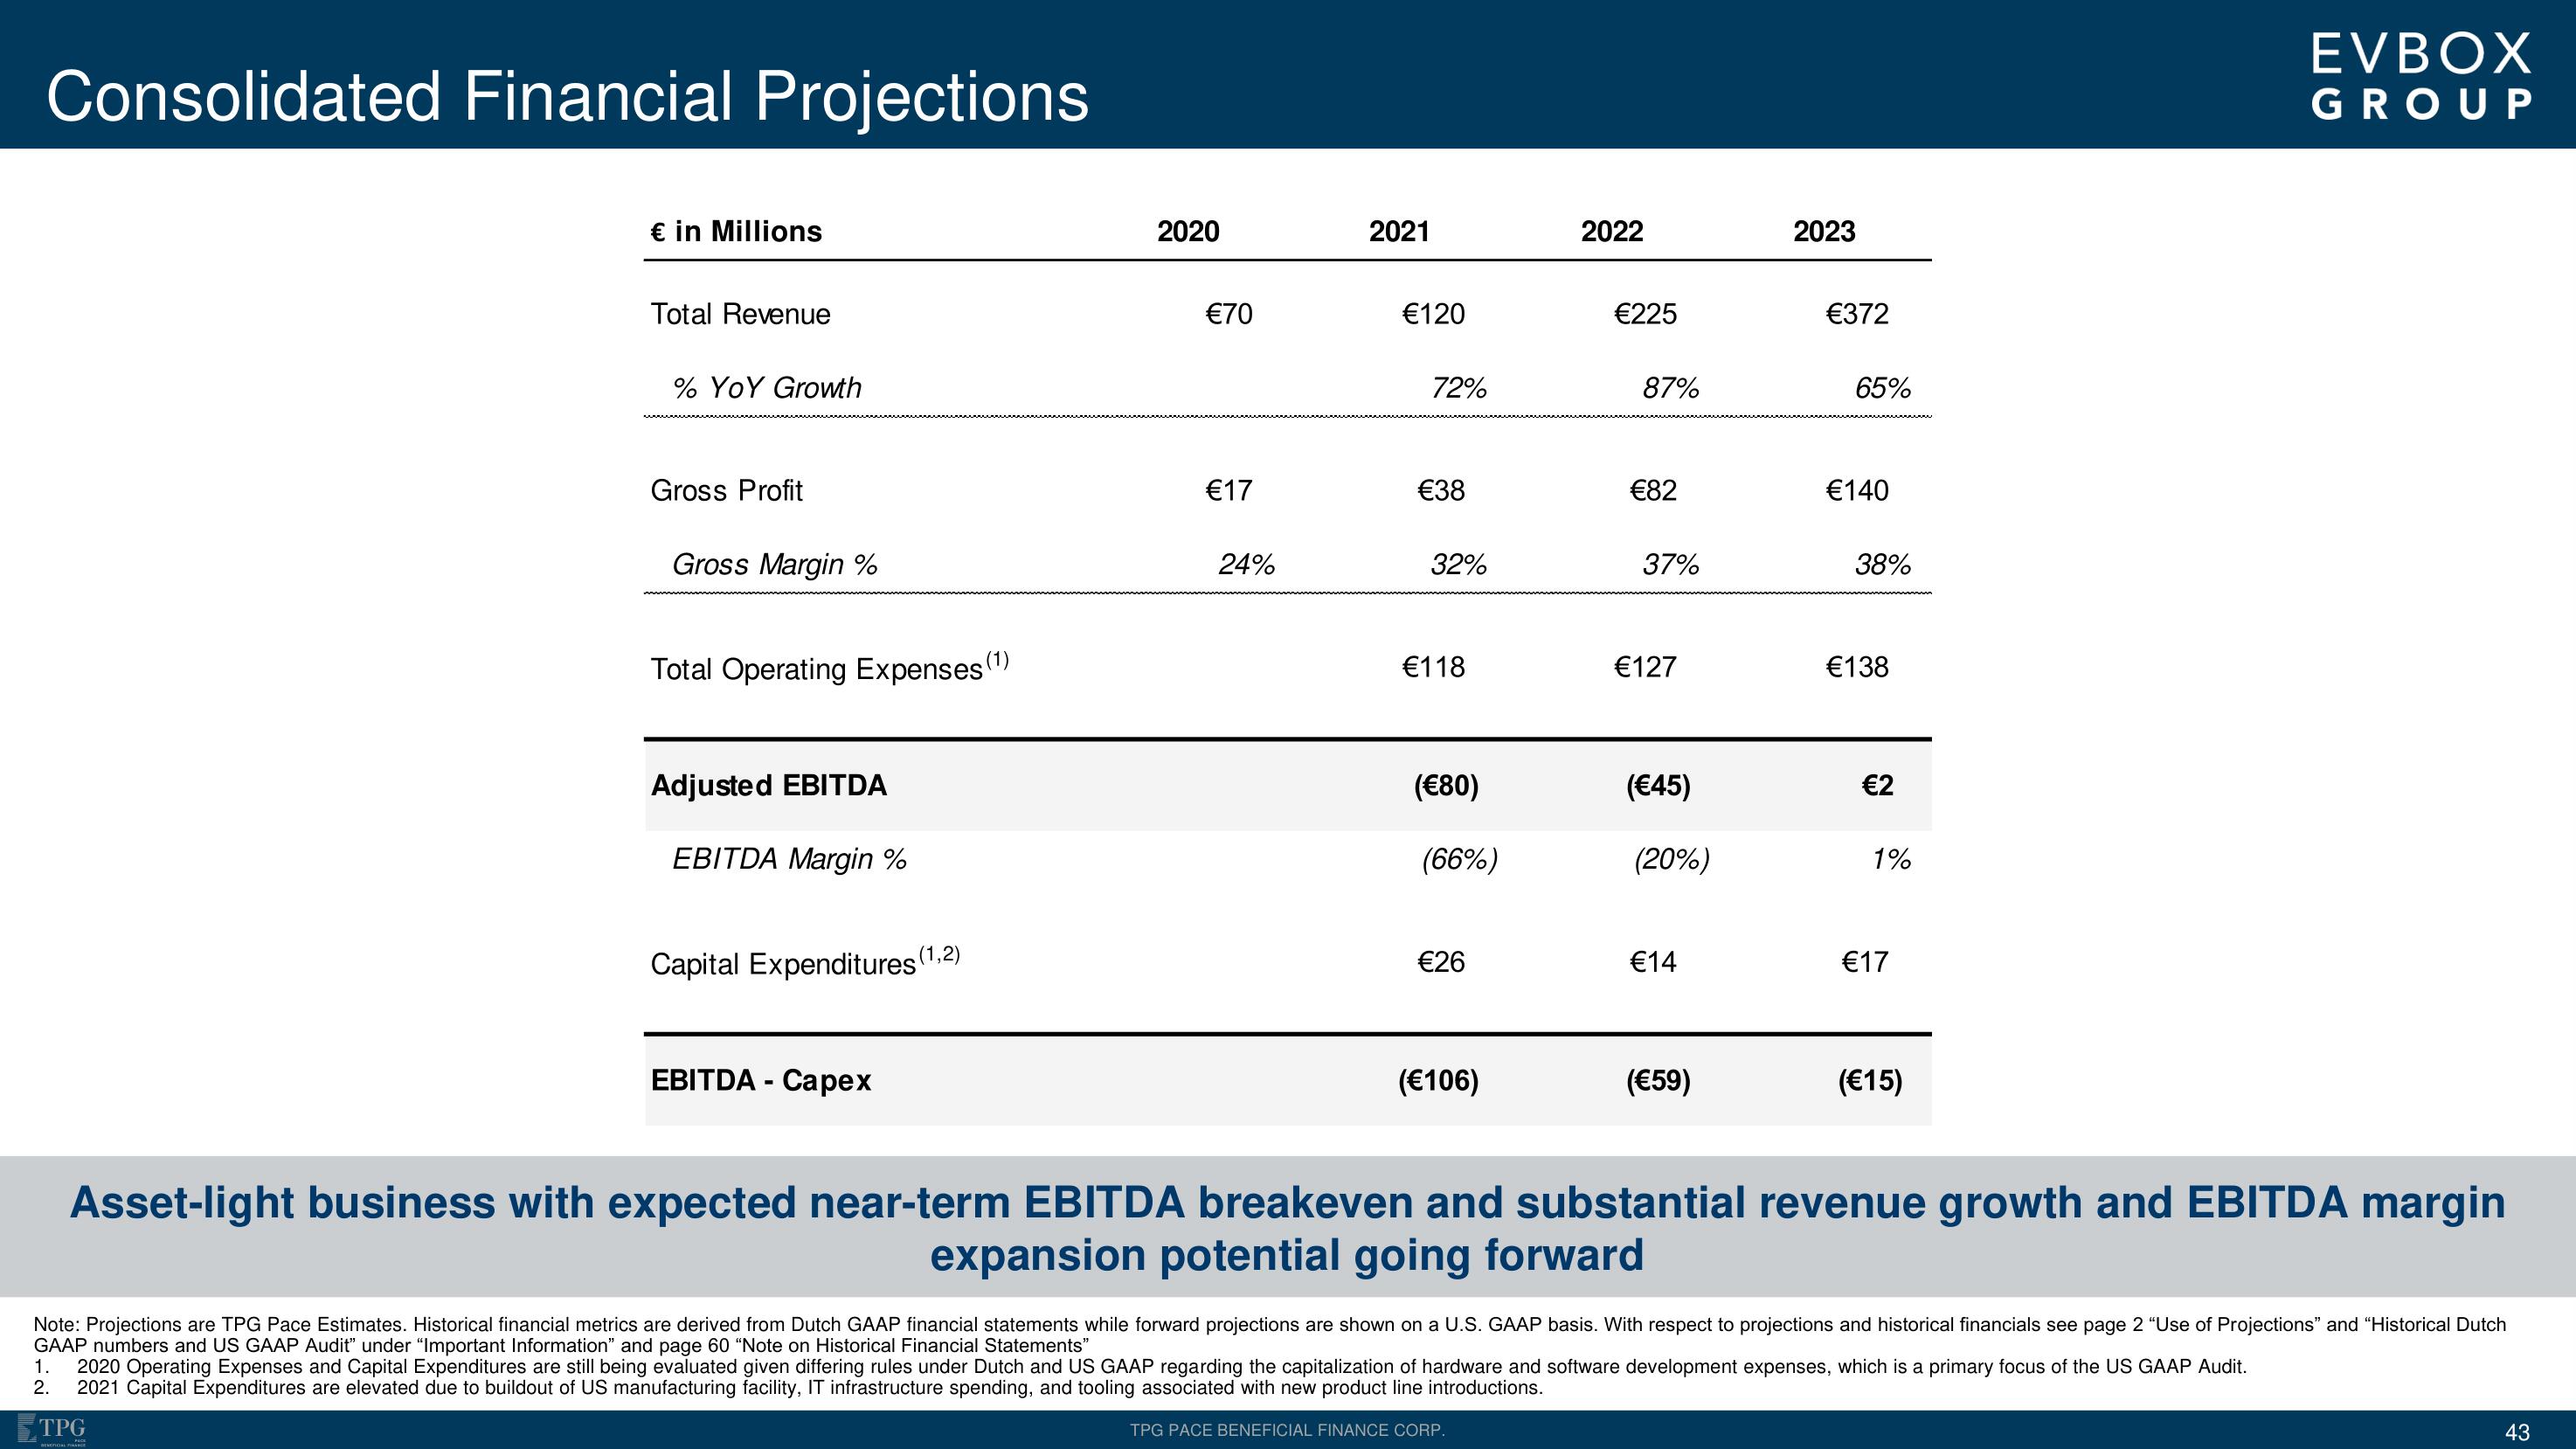
Asset-light business with expected near-term EBITDA breakeven and substantial revenue growth and EBITDA margin
expansion potential going forward
Note: Projections are TPG Pace Estimates. Historical financial metrics are derived from Dutch GAAP financial statements while forward projections are shown on a U.S. GAAP basis. With respect to projections and historical financials see page 2 "Use of Projections" and "Historical Dutch
GAAP numbers and US GAAP Audit" under "Important Information" and page 60 "Note on Historical Financial Statements"
1. 2020 Operating Expenses and Capital Expenditures are still being evaluated given differing rules under Dutch and US GAAP regarding the capitalization of hardware and software development expenses, which is a primary focus of the US GAAP Audit.
2. 2021 Capital Expenditures are elevated due to buildout of US manufacturing facility, IT infrastructure spending, and tooling associated with new product line introductions.
TPG
43View entire presentation