Silicon Valley Bank Results Presentation Deck
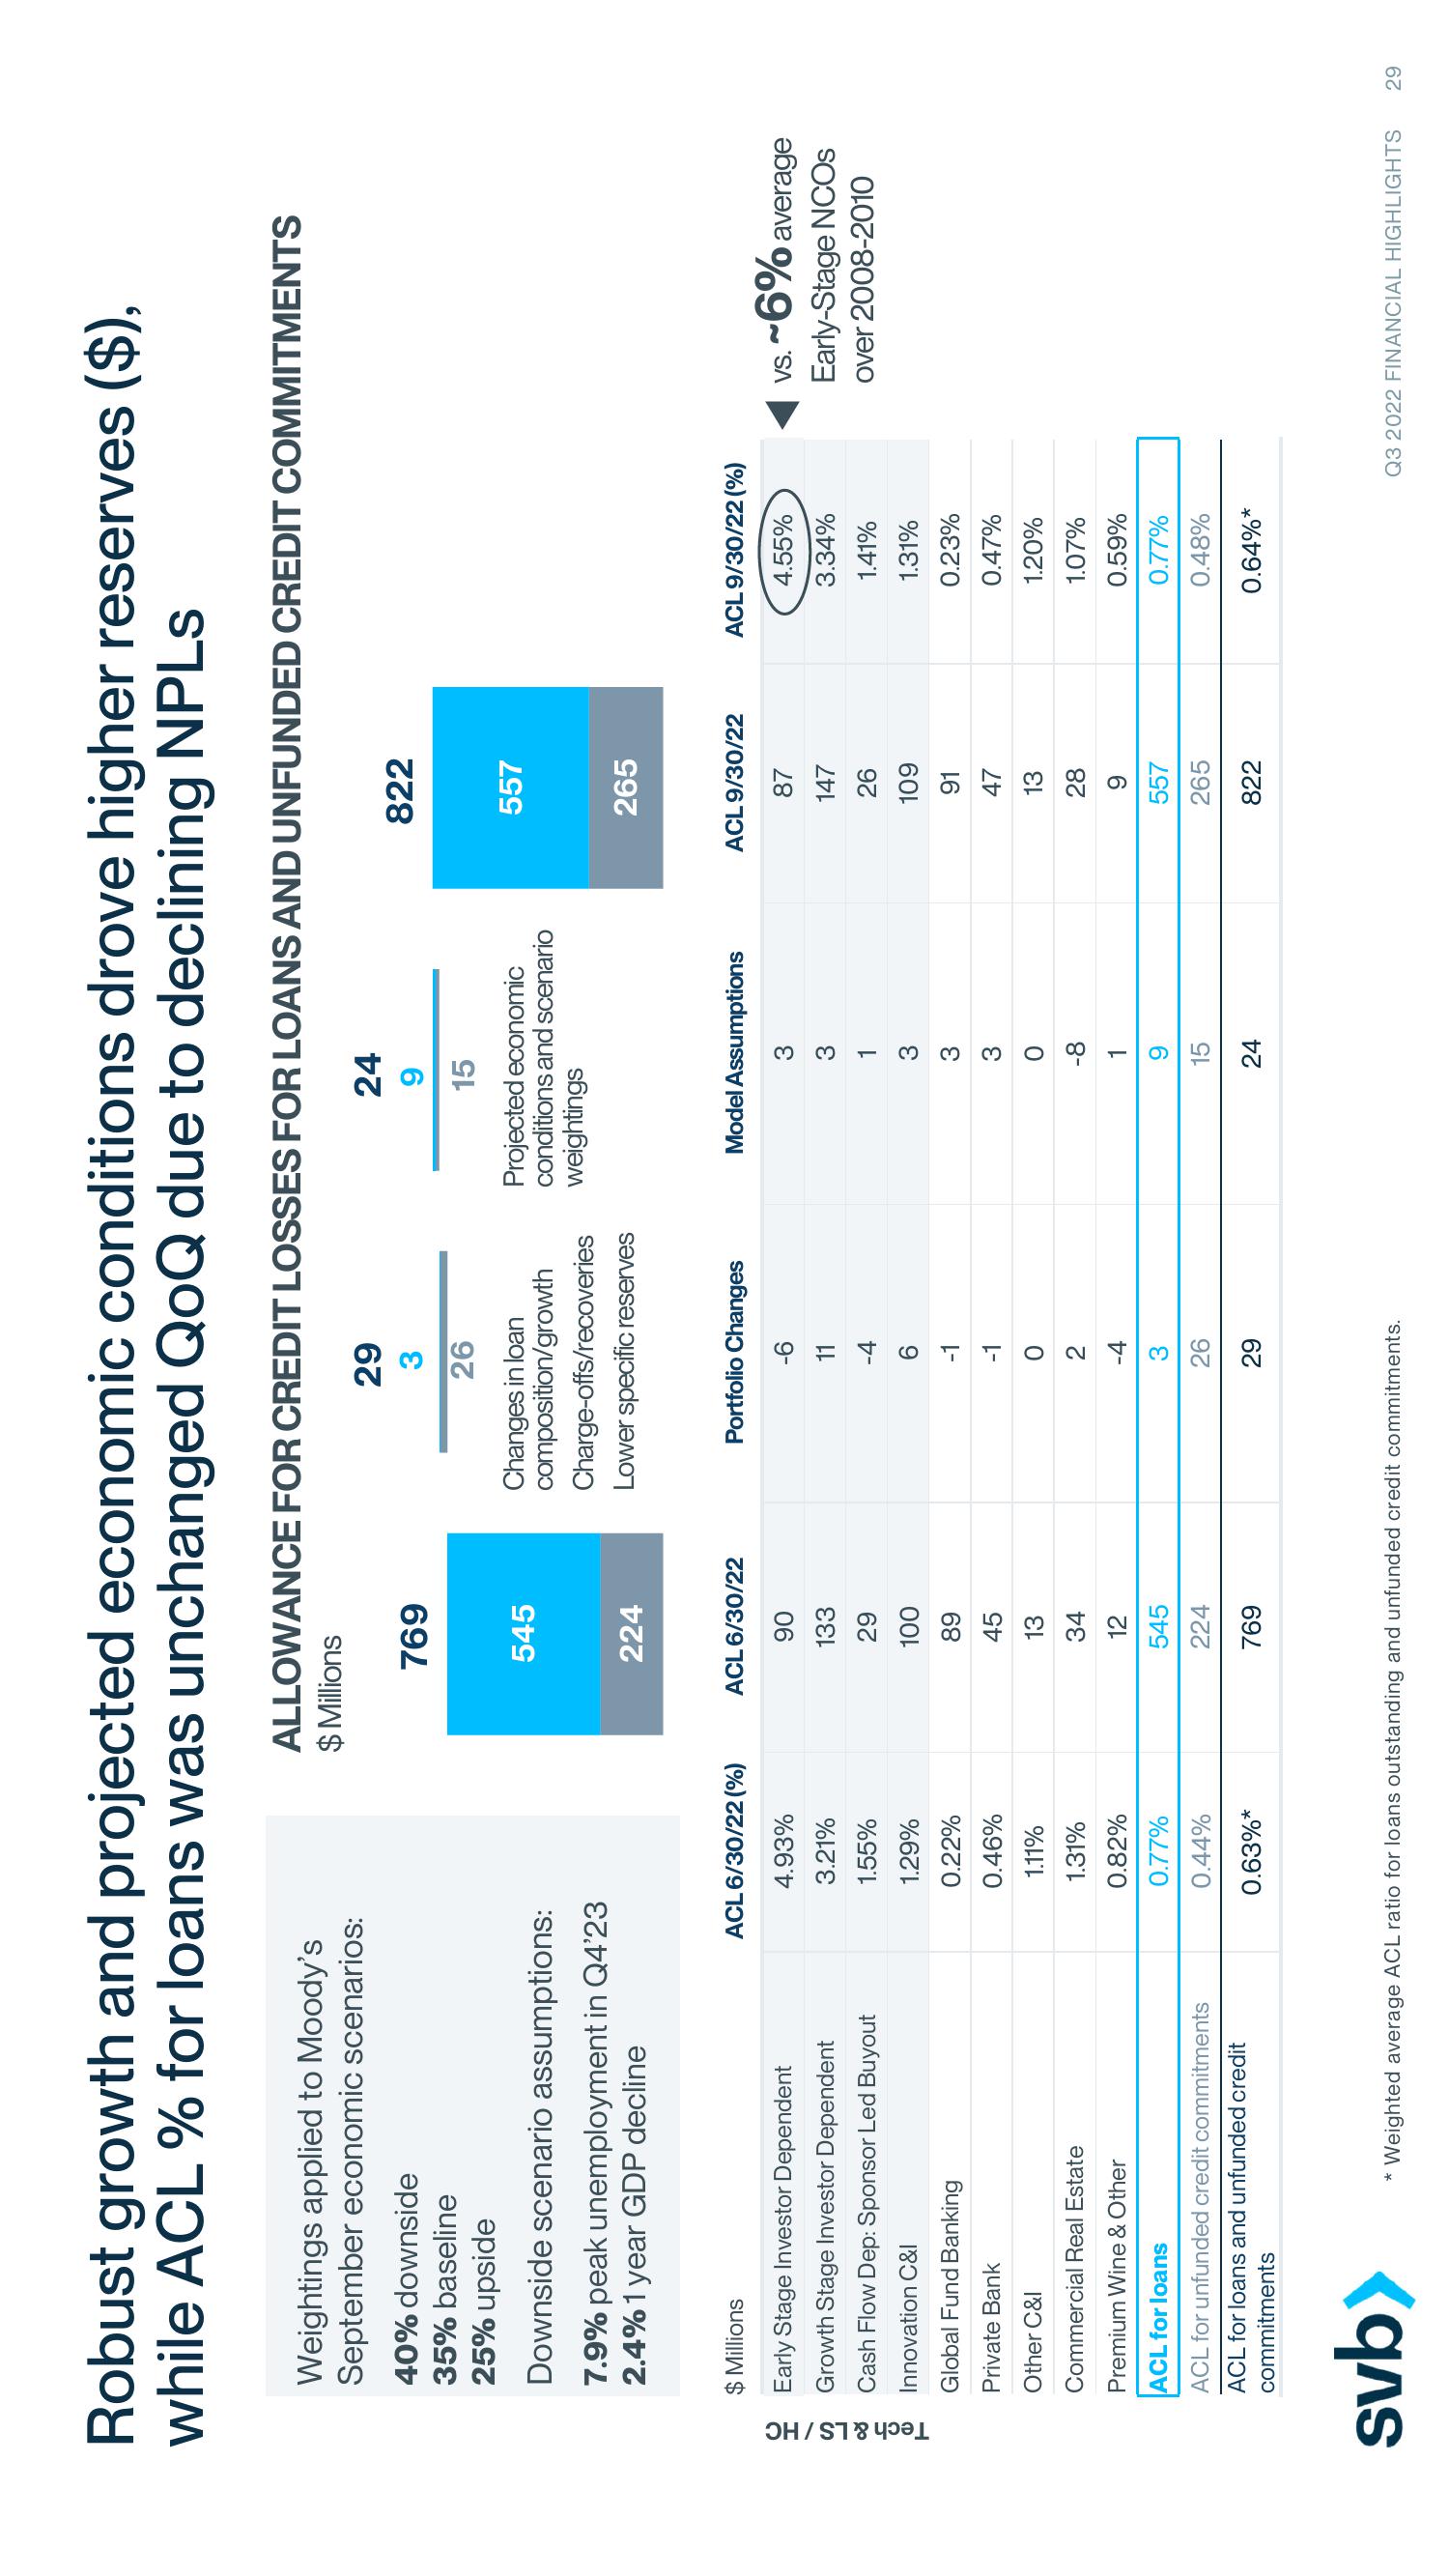
Robust growth and projected economic conditions drove higher reserves ($),
while ACL % for loans was unchanged QoQ due to declining NPLs
Tech & LS / HC
Weightings applied to Moody's
September economic scenarios:
40% downside
35% baseline
25% upside
Downside scenario assumptions:
7.9% peak unemployment in Q4'23
2.4% 1 year GDP decline
$ Millions
Early Stage Investor Dependent
Growth Stage Investor Dependent
Cash Flow Dep: Sponsor Led Buyout
Innovation C&I
Global Fund Banking
Private Bank
Other C&I
Commercial Real Estate
Premium Wine & Other
ACL for loans
ACL for unfunded credit commitments
ACL for loans and unfunded credit
commitments
svb>
ACL 6/30/22 (%)
4.93%
3.21%
1.55%
1.29%
0.22%
0.46%
1.11%
1.31%
0.82%
0.77%
0.44%
0.63%*
ALLOWANCE FOR CREDIT LOSSES FOR LOANS AND UNFUNDED CREDIT COMMITMENTS
$ Millions
769
545
224
ACL 6/30/22
90
133
29
100
89
45
13
34
12
545
224
769
29
3
26
Changes in loan
composition/growth
Charge-offs/recoveries
Lower specific reserves
Portfolio Changes
-6
11
-4
6
-1
WANOL
26
29
* Weighted average ACL ratio for loans outstanding and unfunded credit commitments.
24
9
15
Projected economic
conditions and scenario
weightings
Model Assumptions
♡ ♡ ♡ ♡ ♡ O SEN
3
3
1
3
3
3
-8
1
9
15
24
822
557
265
ACL 9/30/22
87
147
26
109
91
47
13
28
9
557
265
822
ACL 9/30/22 (%)
4.55%
3.34%
1.41%
1.31%
0.23%
0.47%
1.20%
1.07%
0.59%
0.77%
0.48%
0.64%*
vs. ~6% average
Early-Stage NCOS
over 2008-2010
Q3 2022 FINANCIAL HIGHLIGHTS 29View entire presentation