Micro Focus Credit Presentation Deck
3
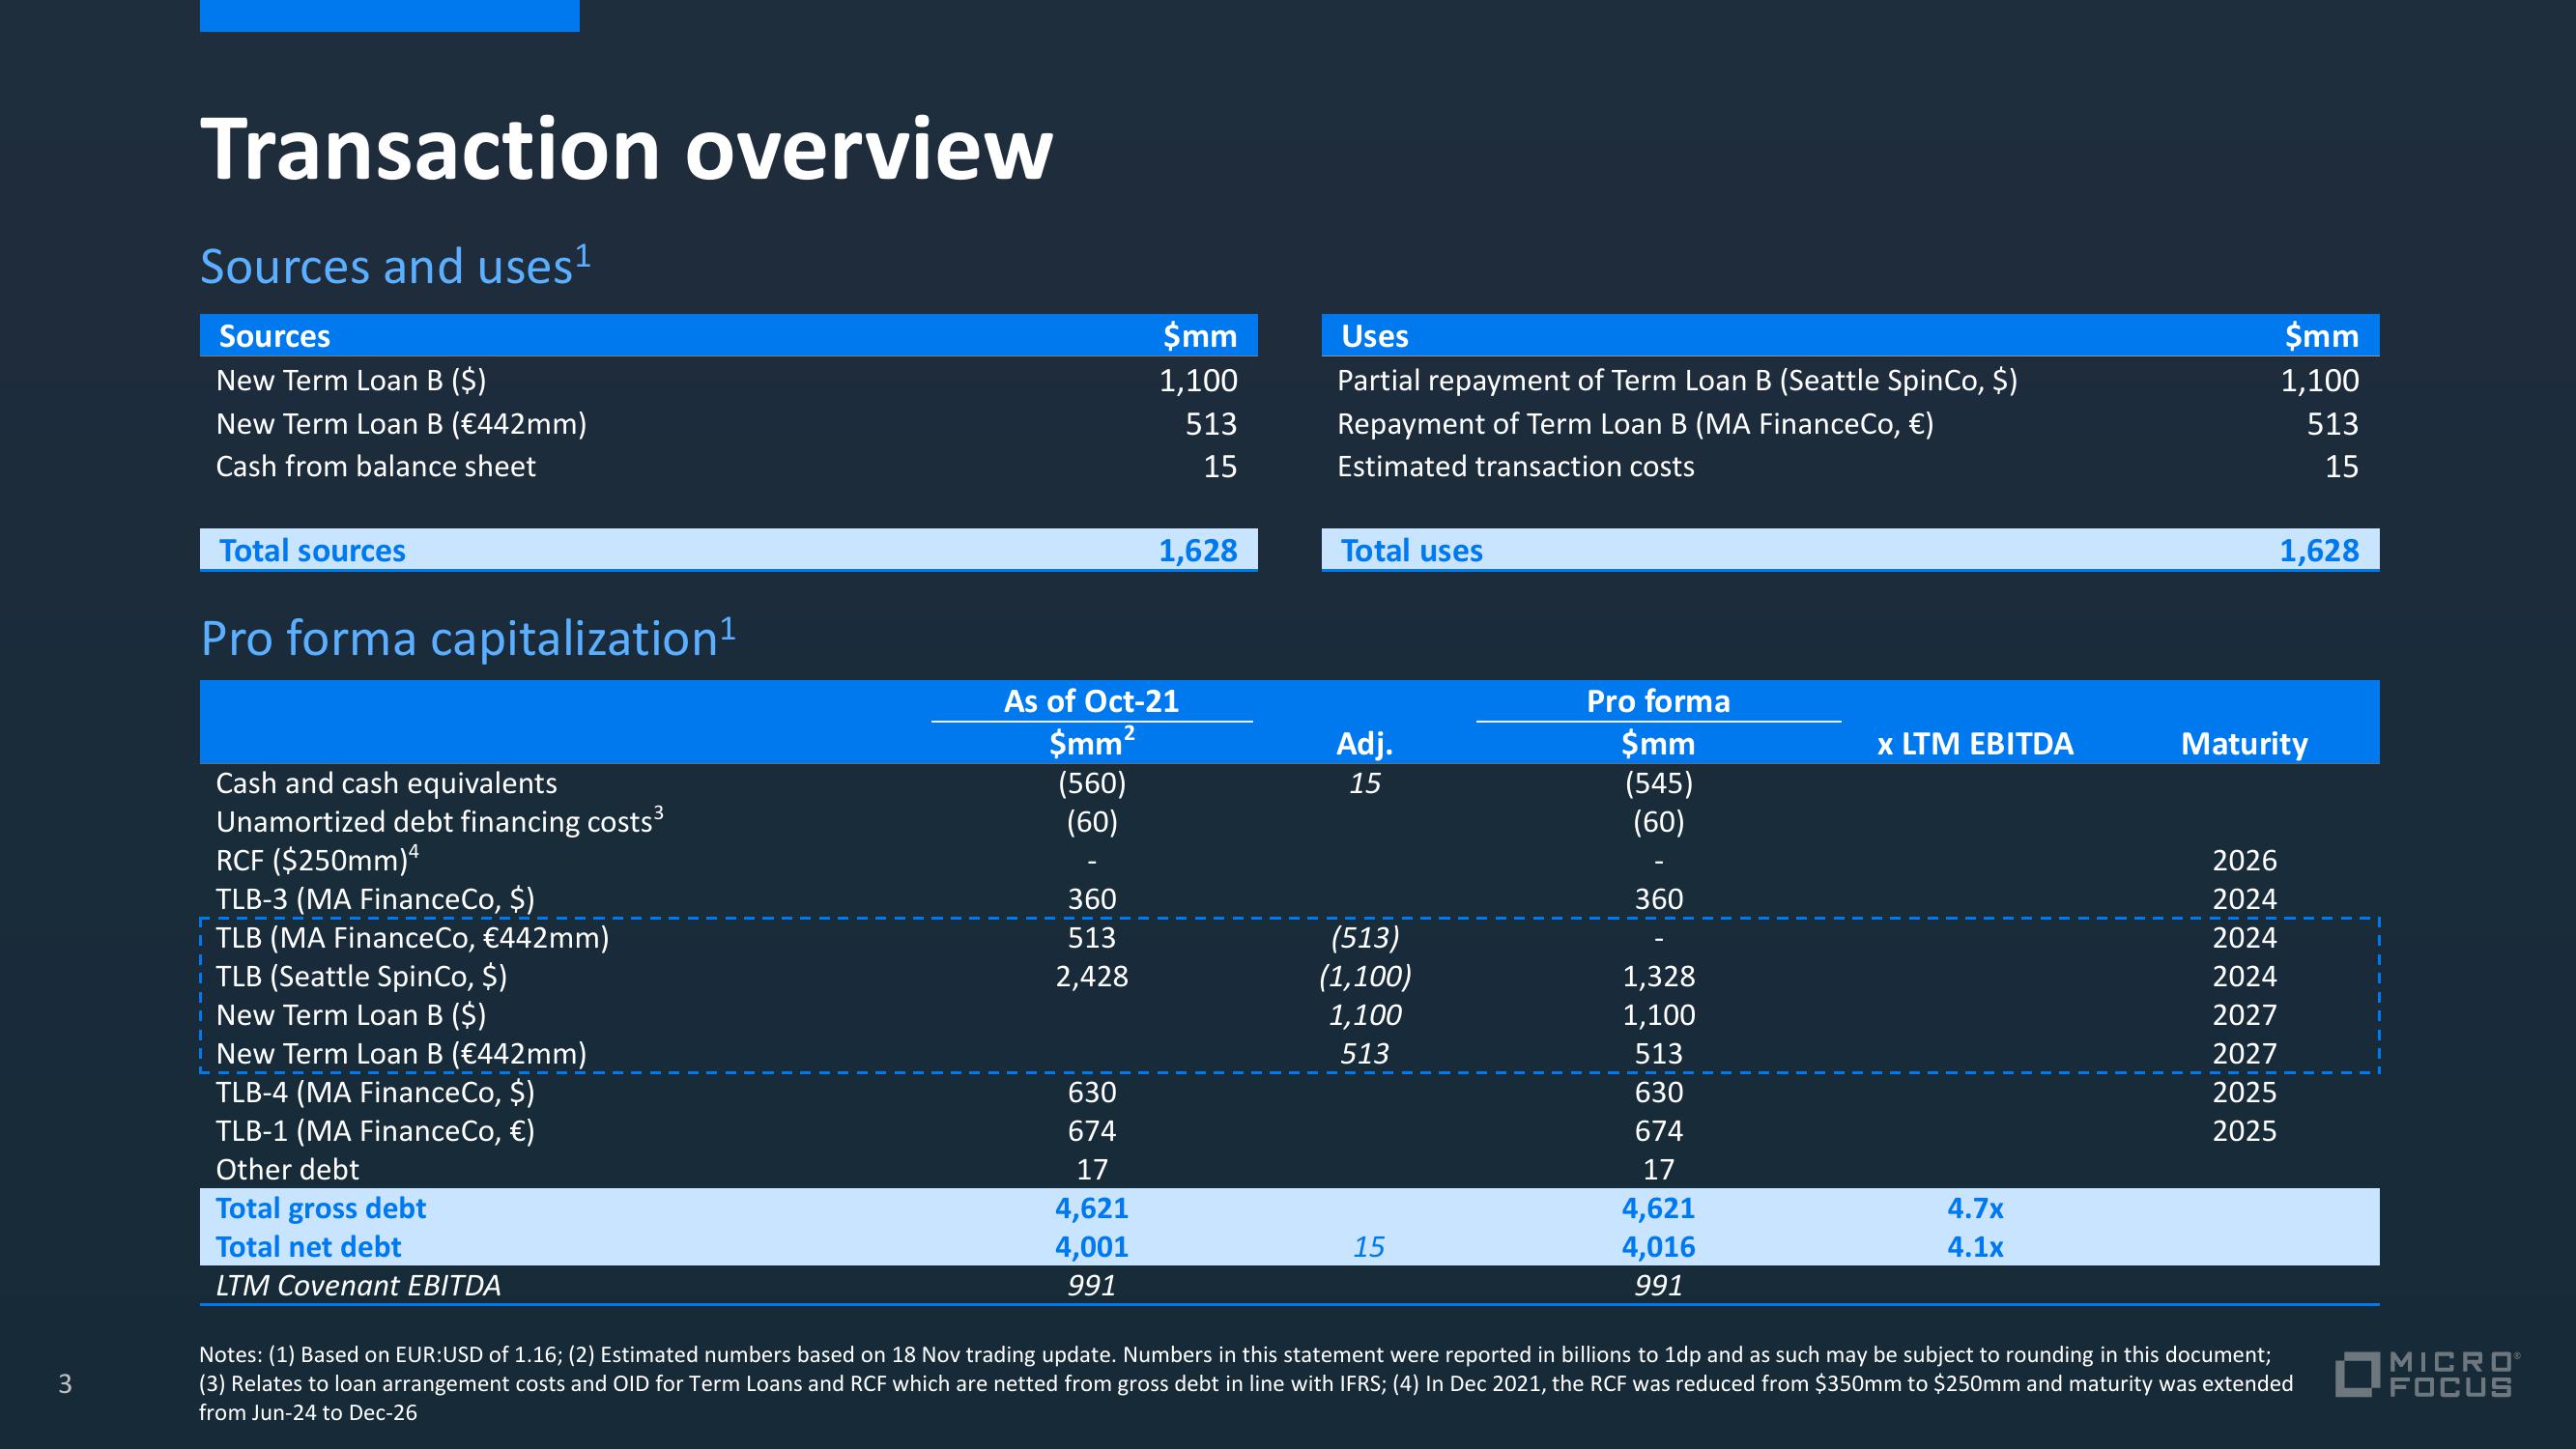
Transaction overview
Sources and uses¹
Sources
New Term Loan B ($)
New Term Loan B (€442mm)
Cash from balance sheet
Total sources
Pro forma capitalization¹
Cash and cash equivalents
Unamortized debt financing costs³
RCF ($250mm)4
TLB-3 (MA Finance Co, $)
TLB (MA FinanceCo, €442mm)
TLB (Seattle SpinCo, $)
New Term Loan B ($)
New Term Loan B (€442mm)
TLB-4 (MA Finance Co, $)
TLB-1 (MA FinanceCo, €)
Other debt
Total gross debt
Total net debt
LTM Covenant EBITDA
360
513
2,428
$mm
1,100
513
15
As of Oct-21
$mm²
(560)
(60)
630
674
17
4,621
4,001
991
1,628
Uses
Partial repayment of Term Loan B (Seattle SpinCo, $)
Repayment of Term Loan B (MA FinanceCo, €)
Estimated transaction costs
Total uses
Adj.
15
(513)
(1,100)
1,100
513
15
Pro forma
$mm
(545)
(60)
360
1,328
1,100
513
630
674
17
4,621
4,016
991
x LTM EBITDA
4.7x
4.1x
$mm
1,100
513
15
2026
2024
2024
2024
2027
2027
2025
2025
1,628
Maturity
Notes: (1) Based on EUR:USD of 1.16; (2) Estimated numbers based on 18 Nov trading update. Numbers in this statement were reported in billions to 1dp and as such may be subject to rounding in this document;
(3) Relates to loan arrangement costs and OID for Term Loans and RCF which are netted from gross debt in line with IFRS; (4) In Dec 2021, the RCF was reduced from $350mm to $250mm and maturity was extended
from Jun-24 to Dec-26
J
I
I
MICROⓇ
FOCUSView entire presentation