Alternus Energy SPAC Presentation Deck
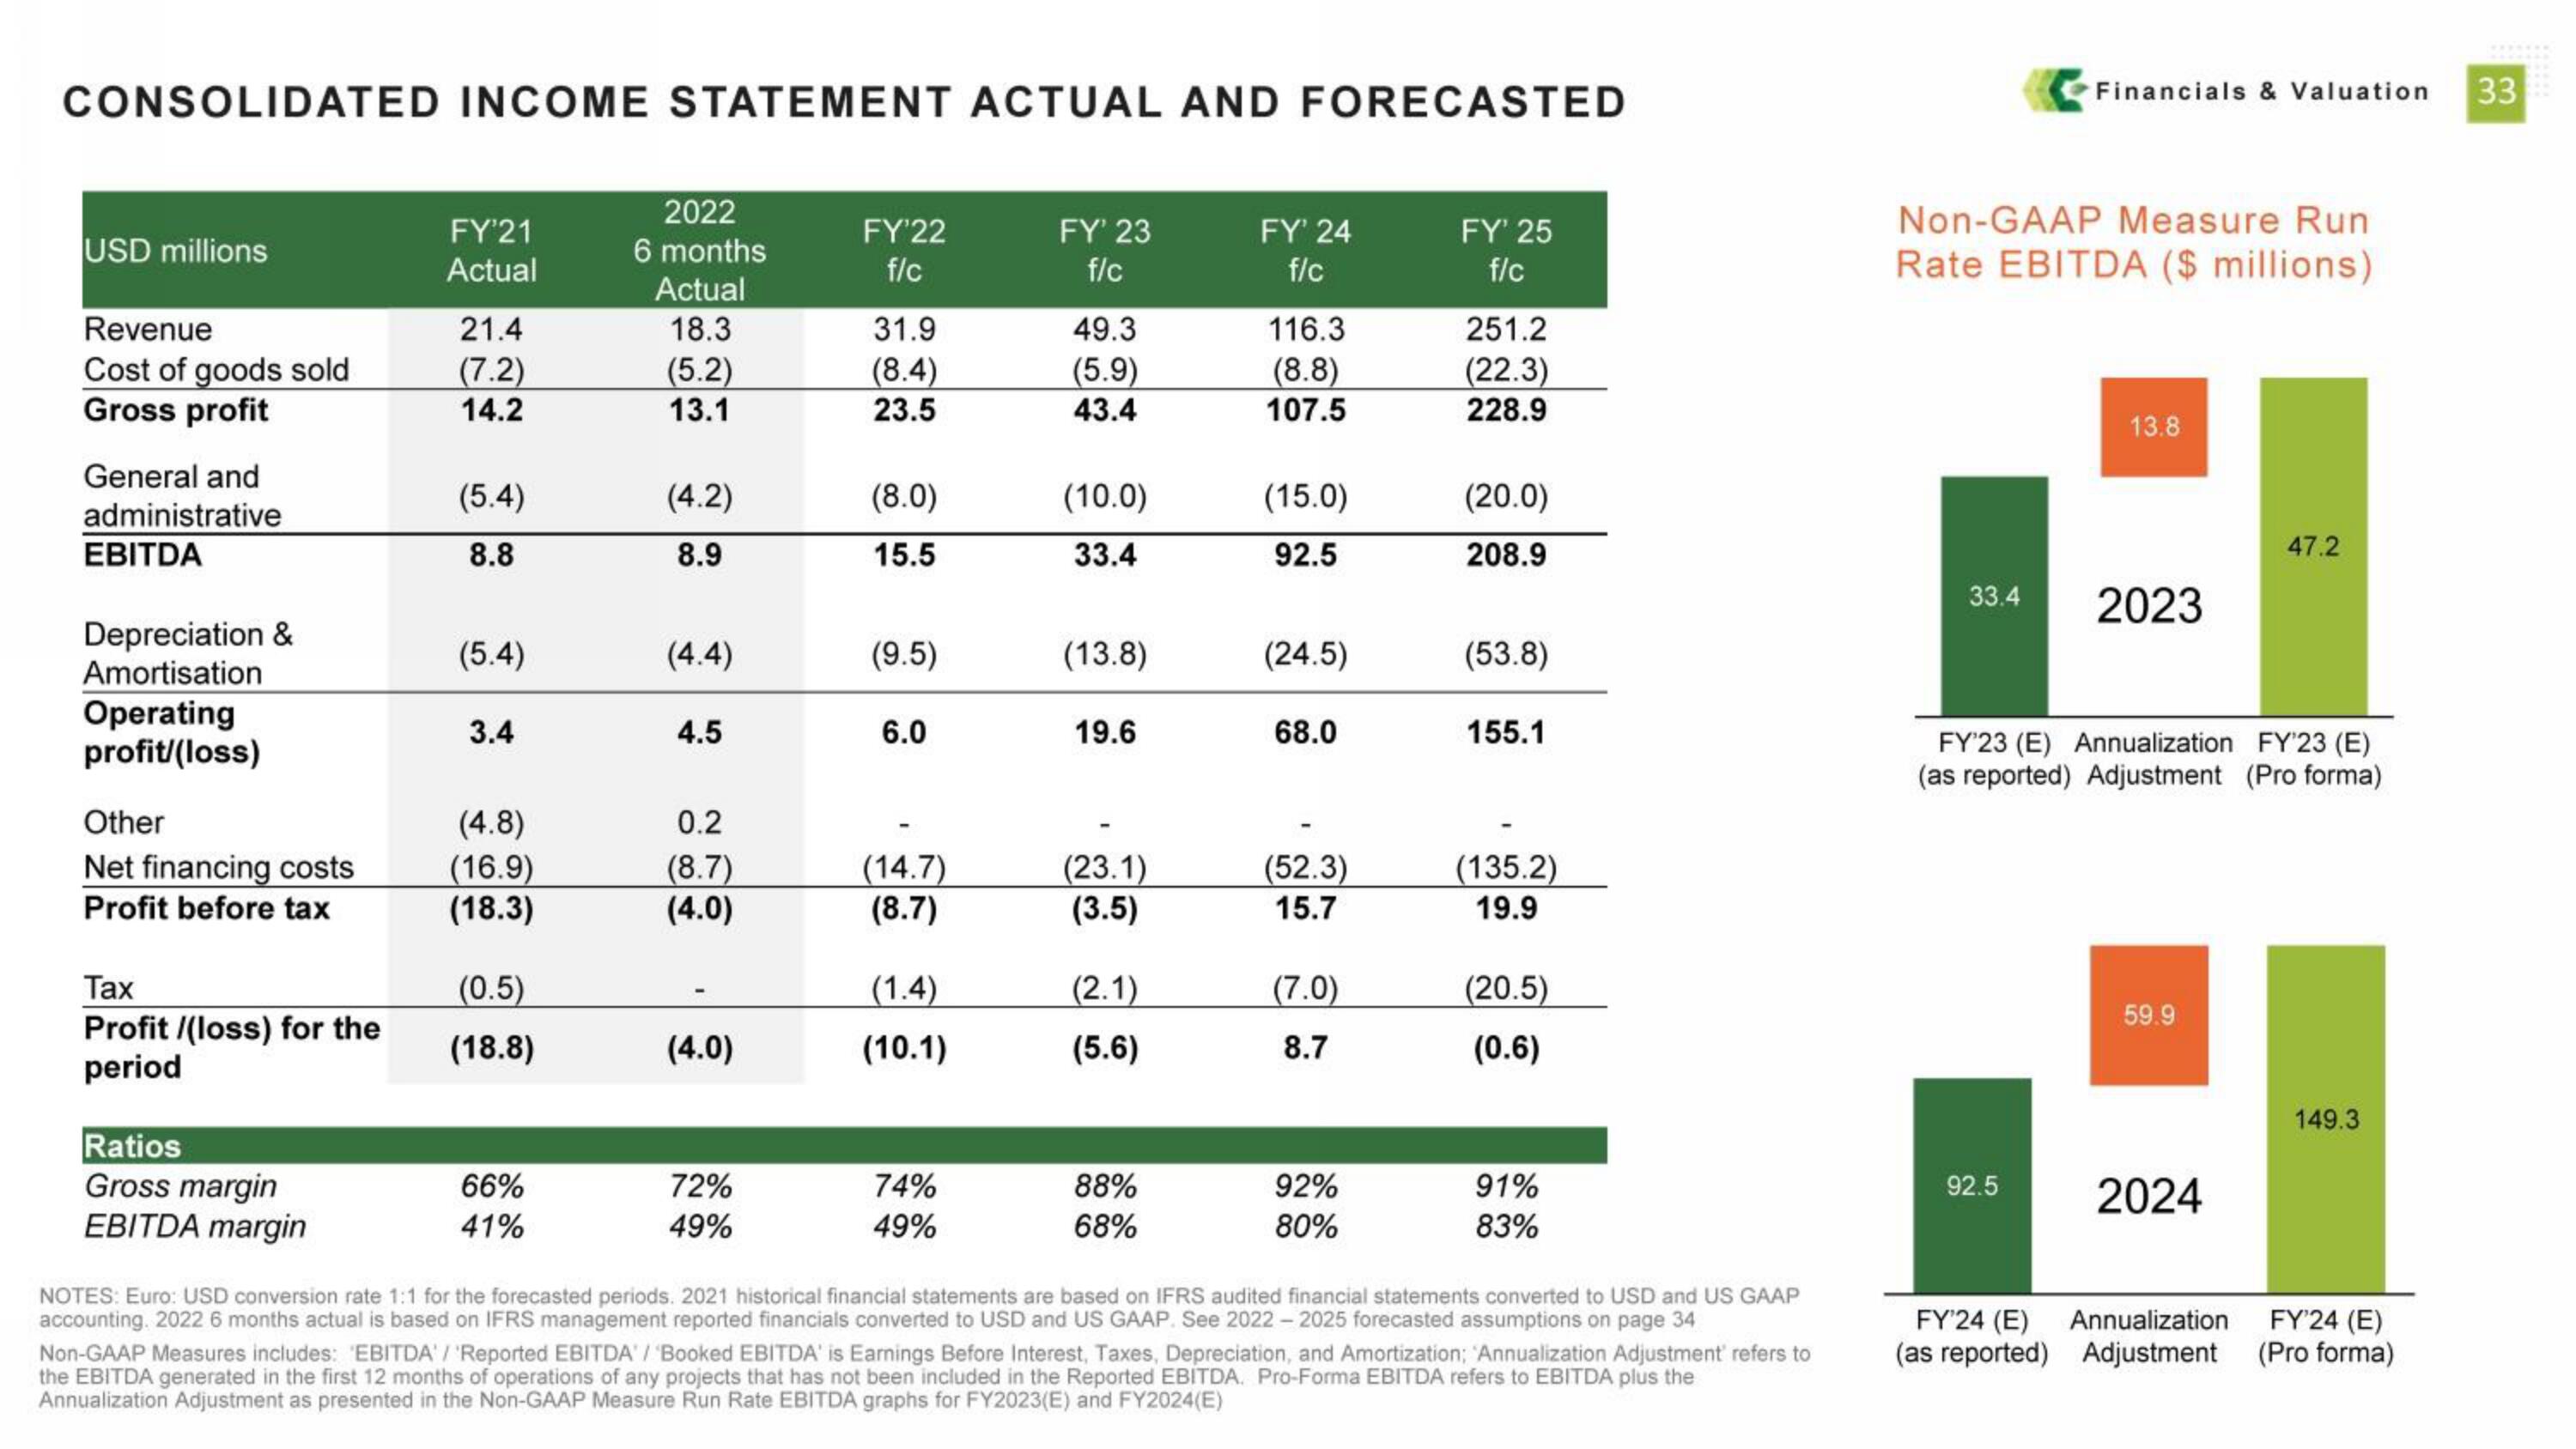
CONSOLIDATED INCOME STATEMENT ACTUAL AND FORECASTED
USD millions
Revenue
Cost of goods sold
Gross profit
General and
administrative
EBITDA
Depreciation &
Amortisation
Operating
profit/(loss)
Other
Net financing costs
Profit before tax
Tax
Profit /(loss) for the
period
Ratios
Gross margin
EBITDA margin
FY'21
Actual
21.4
(7.2)
14.2
(5.4)
8.8
(5.4)
3.4
(4.8)
(16.9)
(18.3)
(0.5)
(18.8)
66%
41%
2022
6 months
Actual
18.3
(5.2)
13.1
(4.2)
8.9
(4.4)
4.5
0.2
(8.7)
(4.0)
(4.0)
72%
49%
FY'22
f/c
31.9
(8.4)
23.5
(8.0)
15.5
(9.5)
6.0
(14.7)
(8.7)
(1.4)
(10.1)
74%
49%
FY' 23
f/c
49.3
(5.9)
43.4
(10.0)
33.4
(13.8)
19.6
(23.1)
(3.5)
(2.1)
(5.6)
88%
68%
FY' 24
f/c
116.3
(8.8)
107.5
(15.0)
92.5
(24.5)
68.0
(52.3)
15.7
(7.0)
8.7
92%
80%
FY' 25
f/c
251.2
(22.3)
228.9
(20.0)
208.9
(53.8)
155.1
(135.2)
19.9
(20.5)
(0.6)
91%
83%
NOTES: Euro: USD conversion rate 1:1 for the forecasted periods. 2021 historical financial statements are based on IFRS audited financial statements converted to USD and US GAAP
accounting, 2022 6 months actual is based on IFRS management reported financials converted to USD and US GAAP. See 2022- 2025 forecasted assumptions on page 34
Non-GAAP Measures includes: 'EBITDA' / 'Reported EBITDA/ Booked EBITDA' is Earnings Before Interest, Taxes, Depreciation, and Amortization; Annualization Adjustment' refers to
the EBITDA generated in the first 12 months of operations of any projects that has not been included in the Reported EBITDA. Pro-Forma EBITDA refers to EBITDA plus the
Annualization Adjustment as presented in the Non-GAAP Measure Run Rate EBITDA graphs for FY2023(E) and FY2024(E)
Financials & Valuation
Non-GAAP Measure Run
Rate EBITDA ($ millions)
13.8
33.4 2023
92.5
FY'23 (E) Annualization FY'23 (E)
(as reported) Adjustment (Pro forma)
59.9
2024
47.2
FY'24 (E) Annualization
(as reported) Adjustment
149.3
FY'24 (E)
(Pro forma)
33View entire presentation