NuStar Energy Investor Conference Presentation Deck
NuStar
Total
Refined
Products:
100
50
Refined Products
Which Have Been Resilient and Where We Expect to
Continue to See Strong, Consistent Demand for Our Services
Central West
Region
65%
April 2020
90% 90%
1Q 2021
2Q 2021
April 2020¹
70%
100
50
75%
South Texas
1Q 2021¹
1Q 2021
April 2020
95%
90%
100%
2Q 2021
100
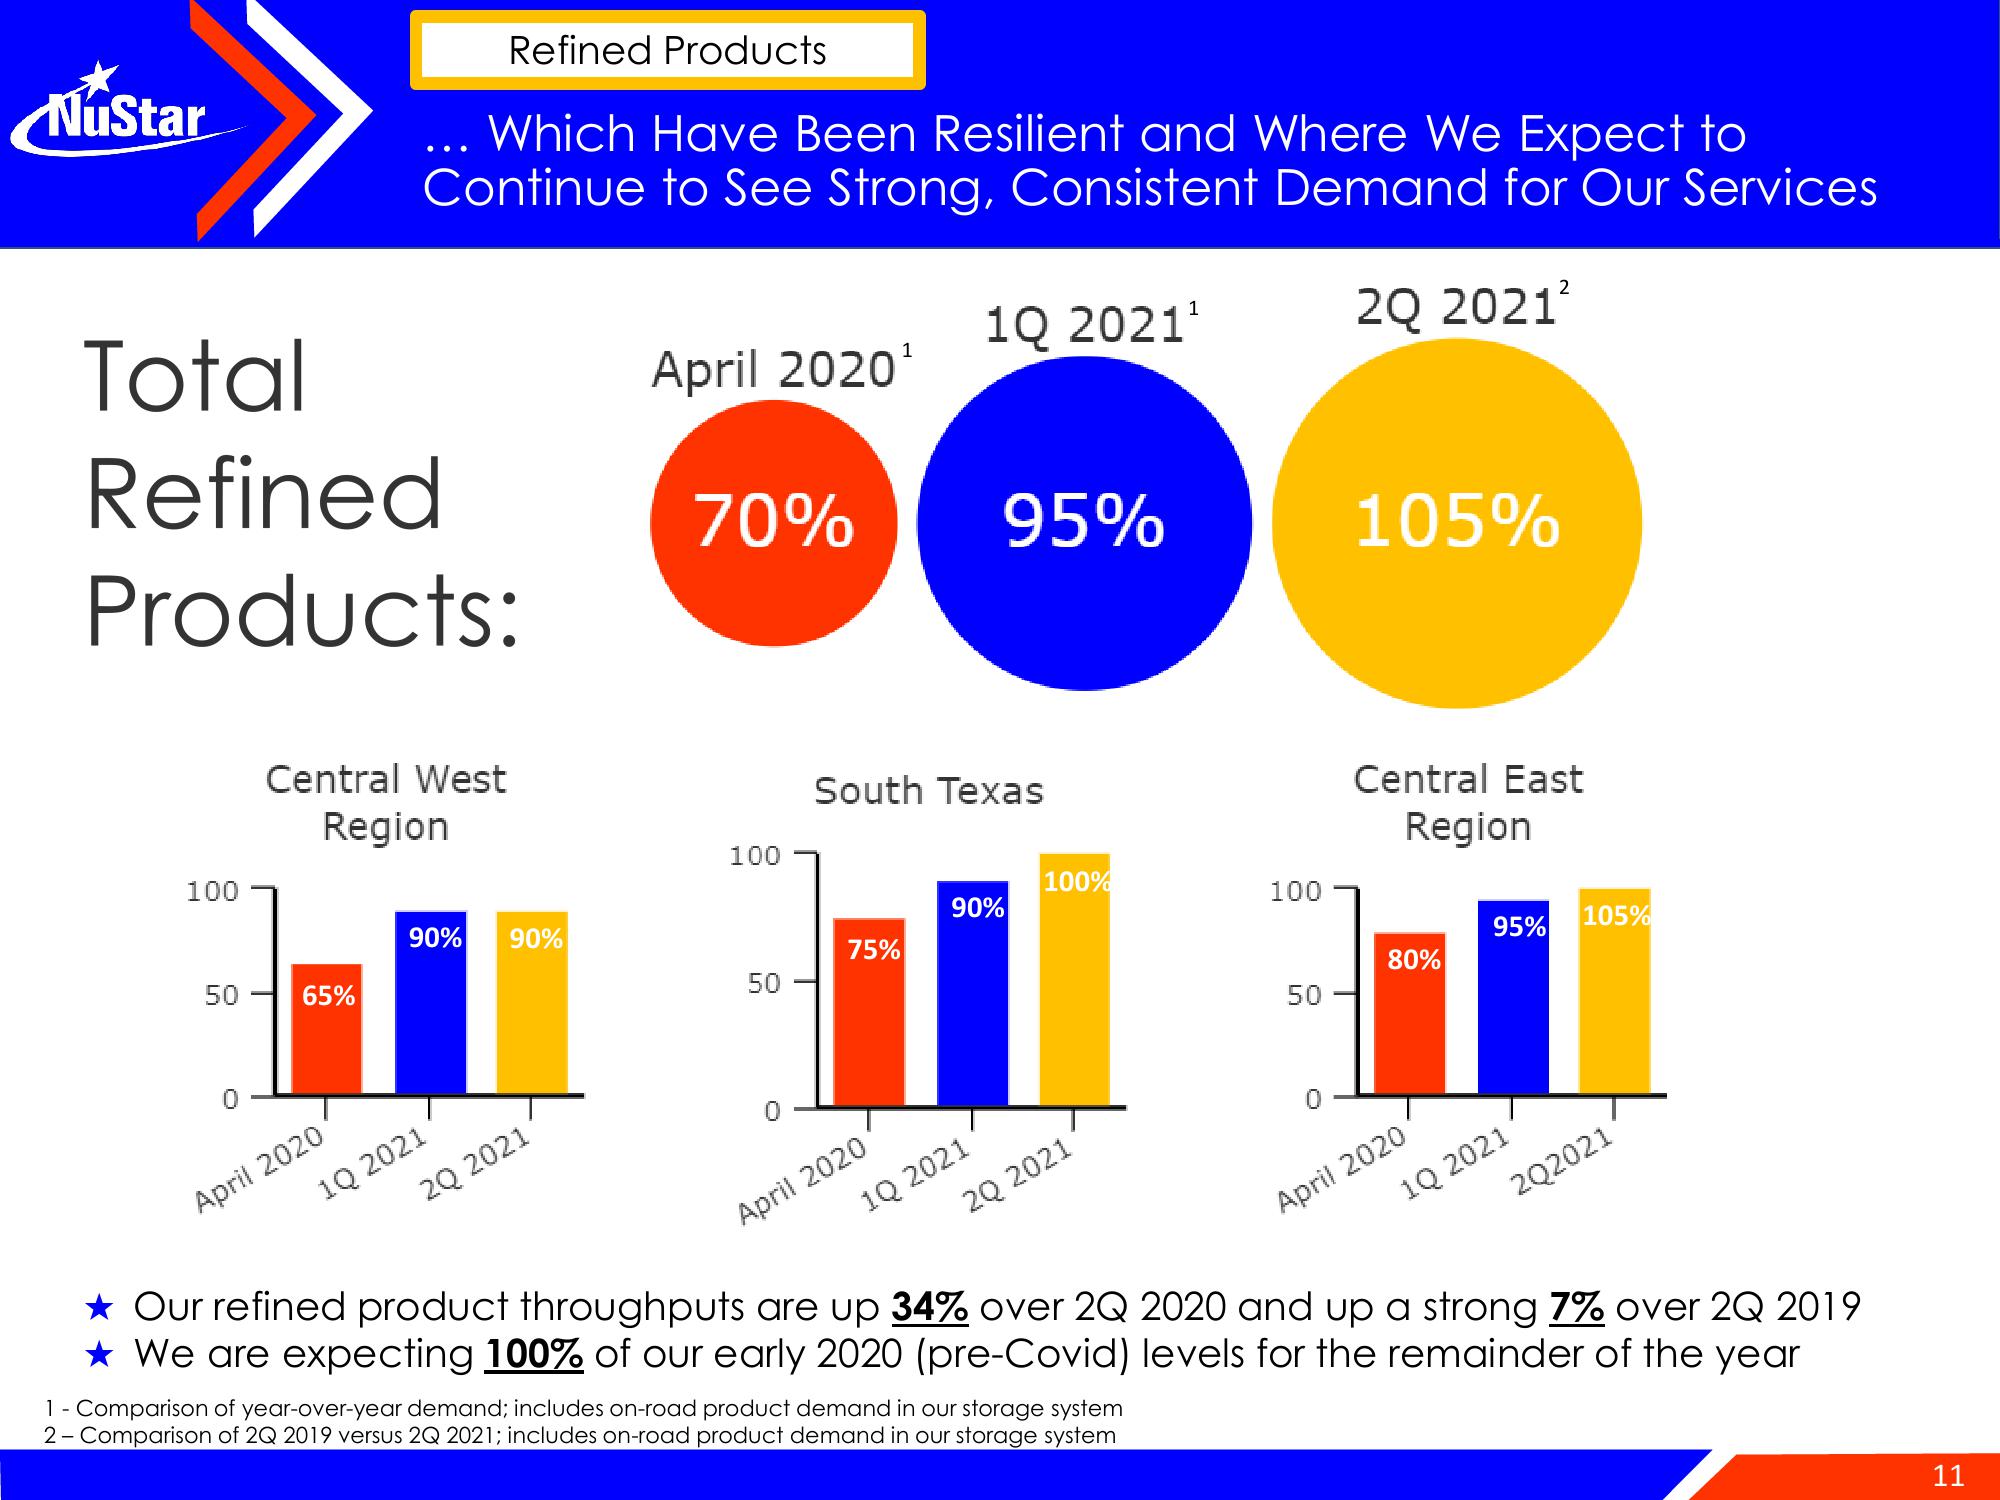
1 - Comparison of year-over-year demand; includes on-road product demand in our storage system
2- Comparison of 2Q 2019 versus 2Q 2021; includes on-road product demand in our storage system
50
2Q 2021
105%
Central East
Region
80%
2
April 2020
1Q
95% 105%
2021
2Q2021
★ Our refined product throughputs are up 34% over 2Q 2020 and up a strong 7% over 2Q 2019
★ We are expecting 100% of our early 2020 (pre-Covid) levels for the remainder of the year
11View entire presentation