Bed Bath & Beyond Results Presentation Deck slide image

Bed Bath & Beyond Results Presentation Deck

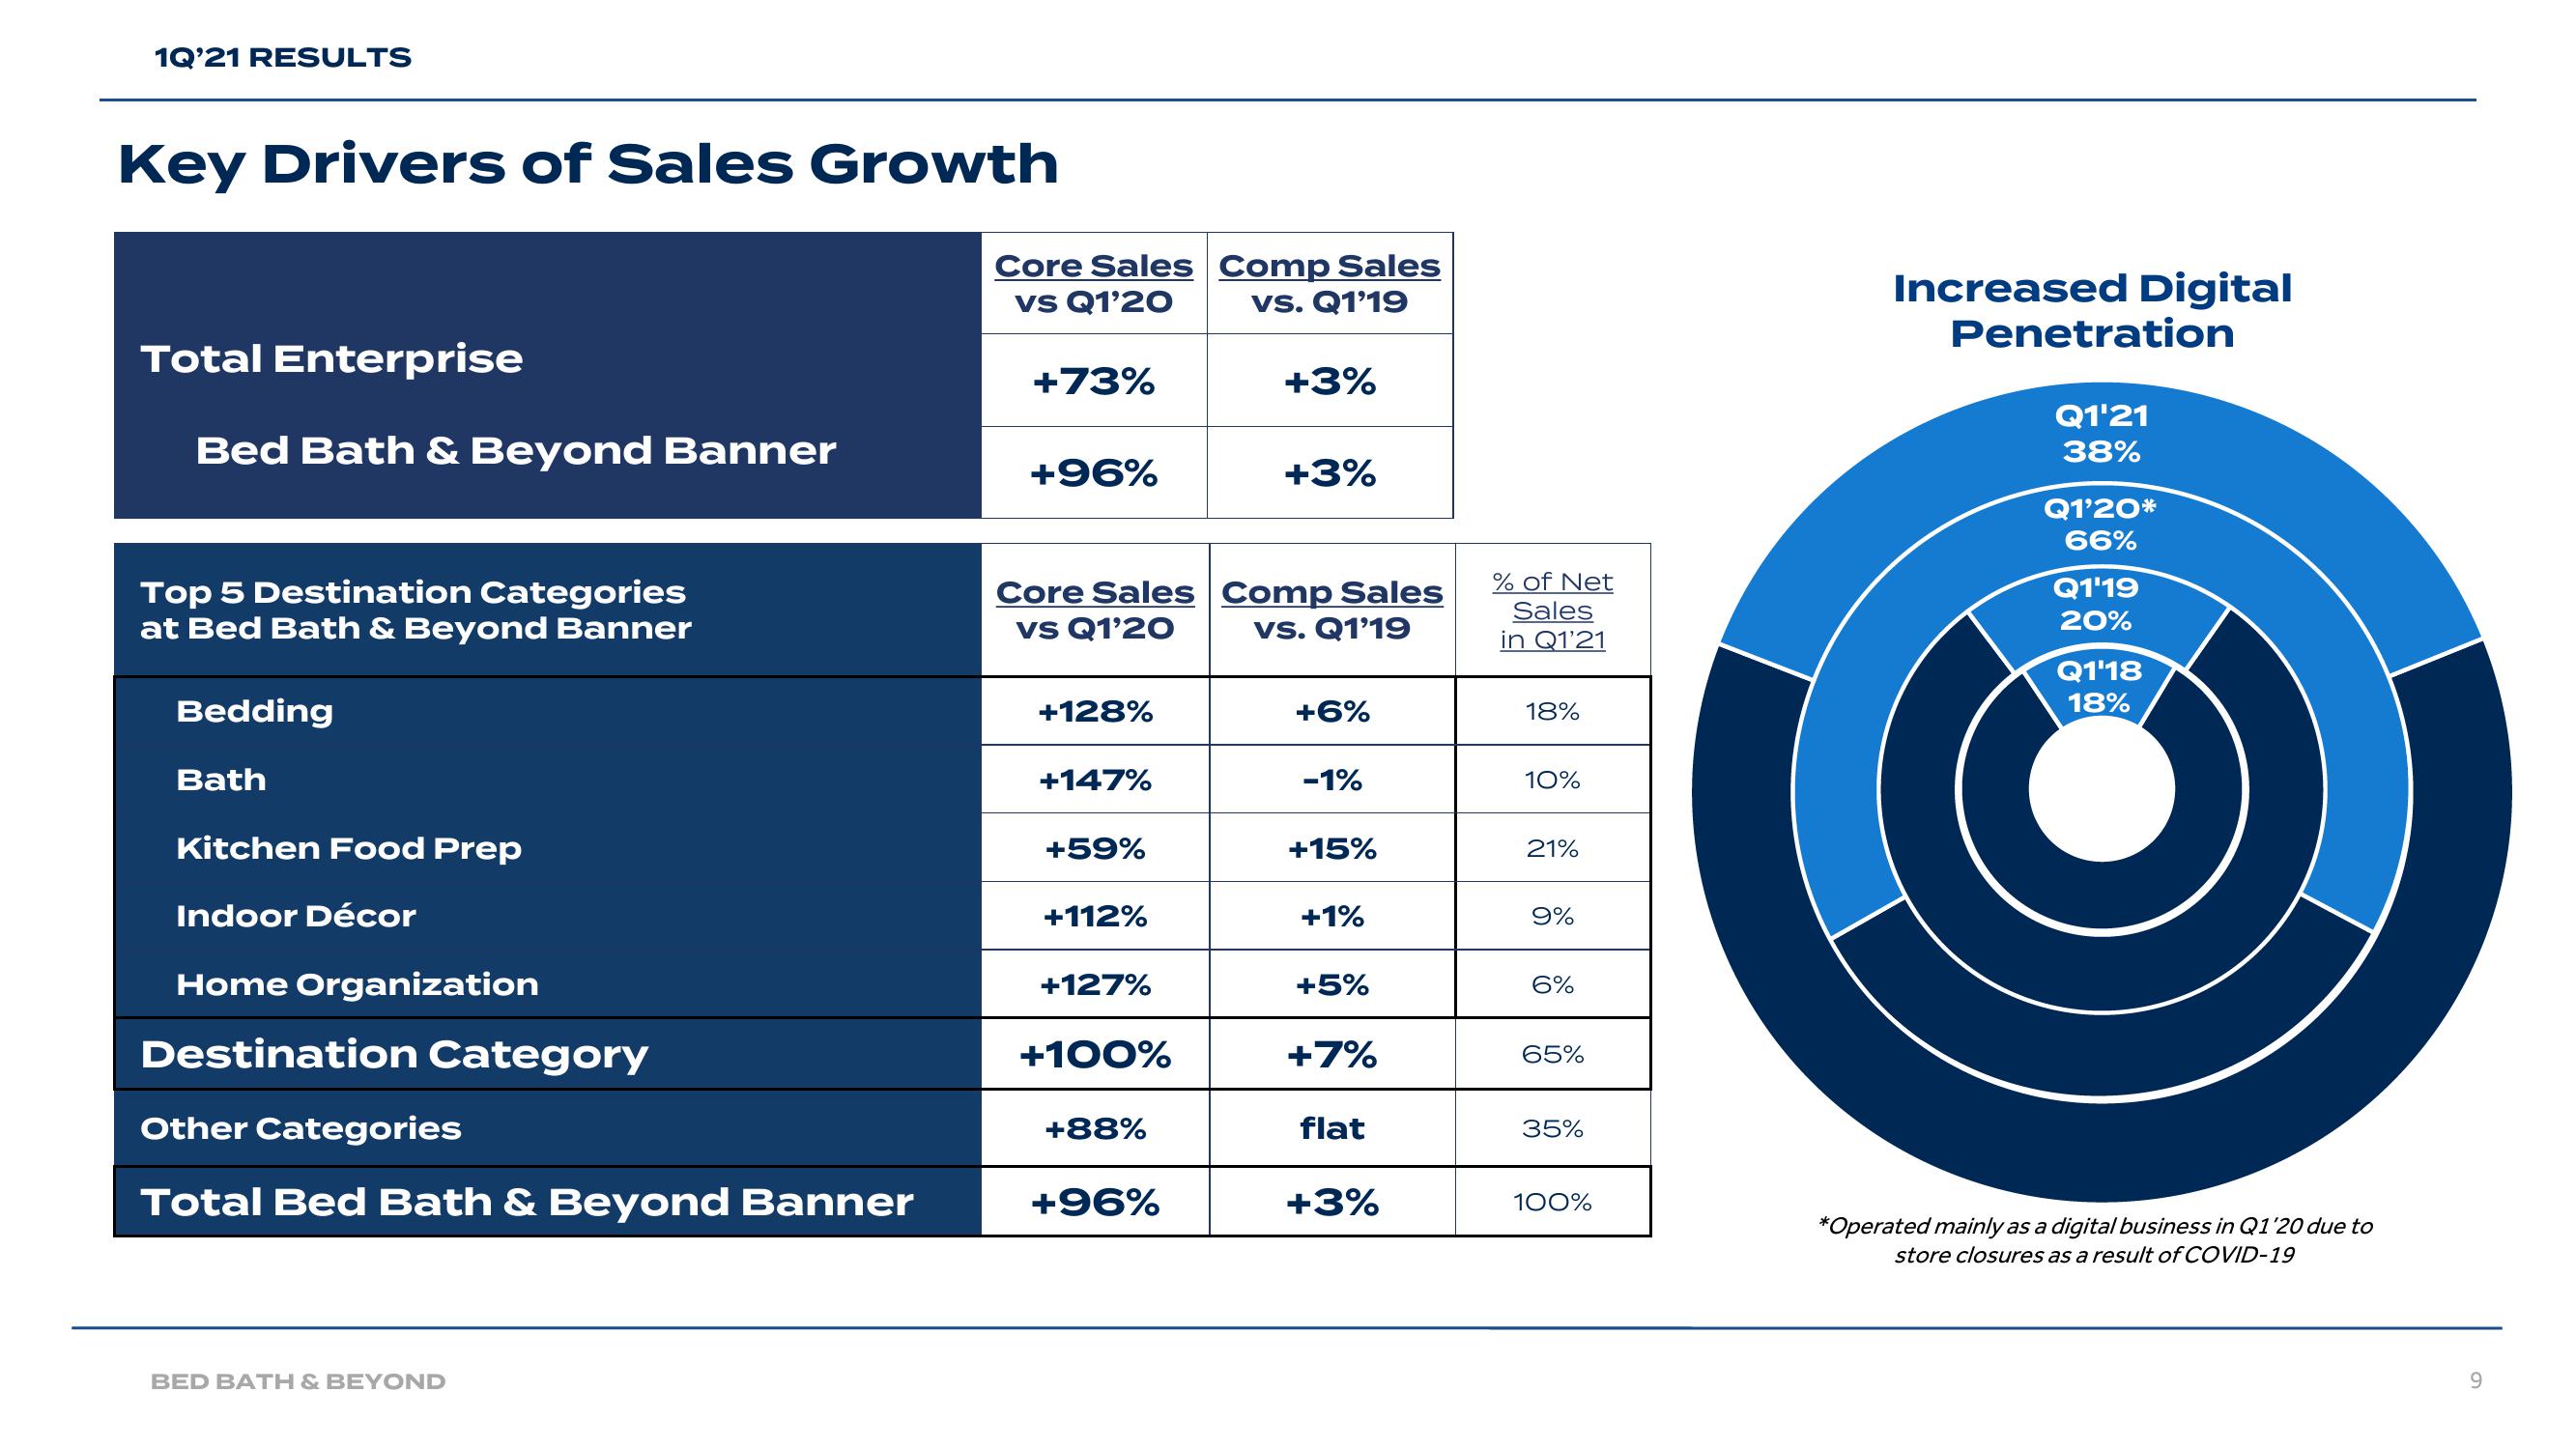
1Q'21 RESULTS Key Drivers of Sales Growth Total Enterprise Bed Bath & Beyond Banner Top 5 Destination Categories at Bed Bath & Beyond Banner Bedding Bath Kitchen Food Prep Indoor Décor Home Organization Destination Category Other Categories Total Bed Bath & Beyond Banner BED BATH & BEYOND Core Sales vs Q1'20 +73% +96% Core Sales vs Q1'20 +128% +147% +59% +112% +127% +100% +88% +96% Comp Sales vs. Q1'19 +3% +3% Comp Sales vs. Q1'19 +6% -1% +15% +1% +5% +7% flat +3% % of Net Sales in Q1'21 18% 10% 21% 9% 6% 65% 35% 100% Increased Digital Penetration Q1'21 38% Q1'20* 66% Q1'19 20% Q1'18 18% *Operated mainly as a digital business in Q1'20 due to store closures as a result of COVID-19 9
View entire presentation