Uber Results Presentation Deck
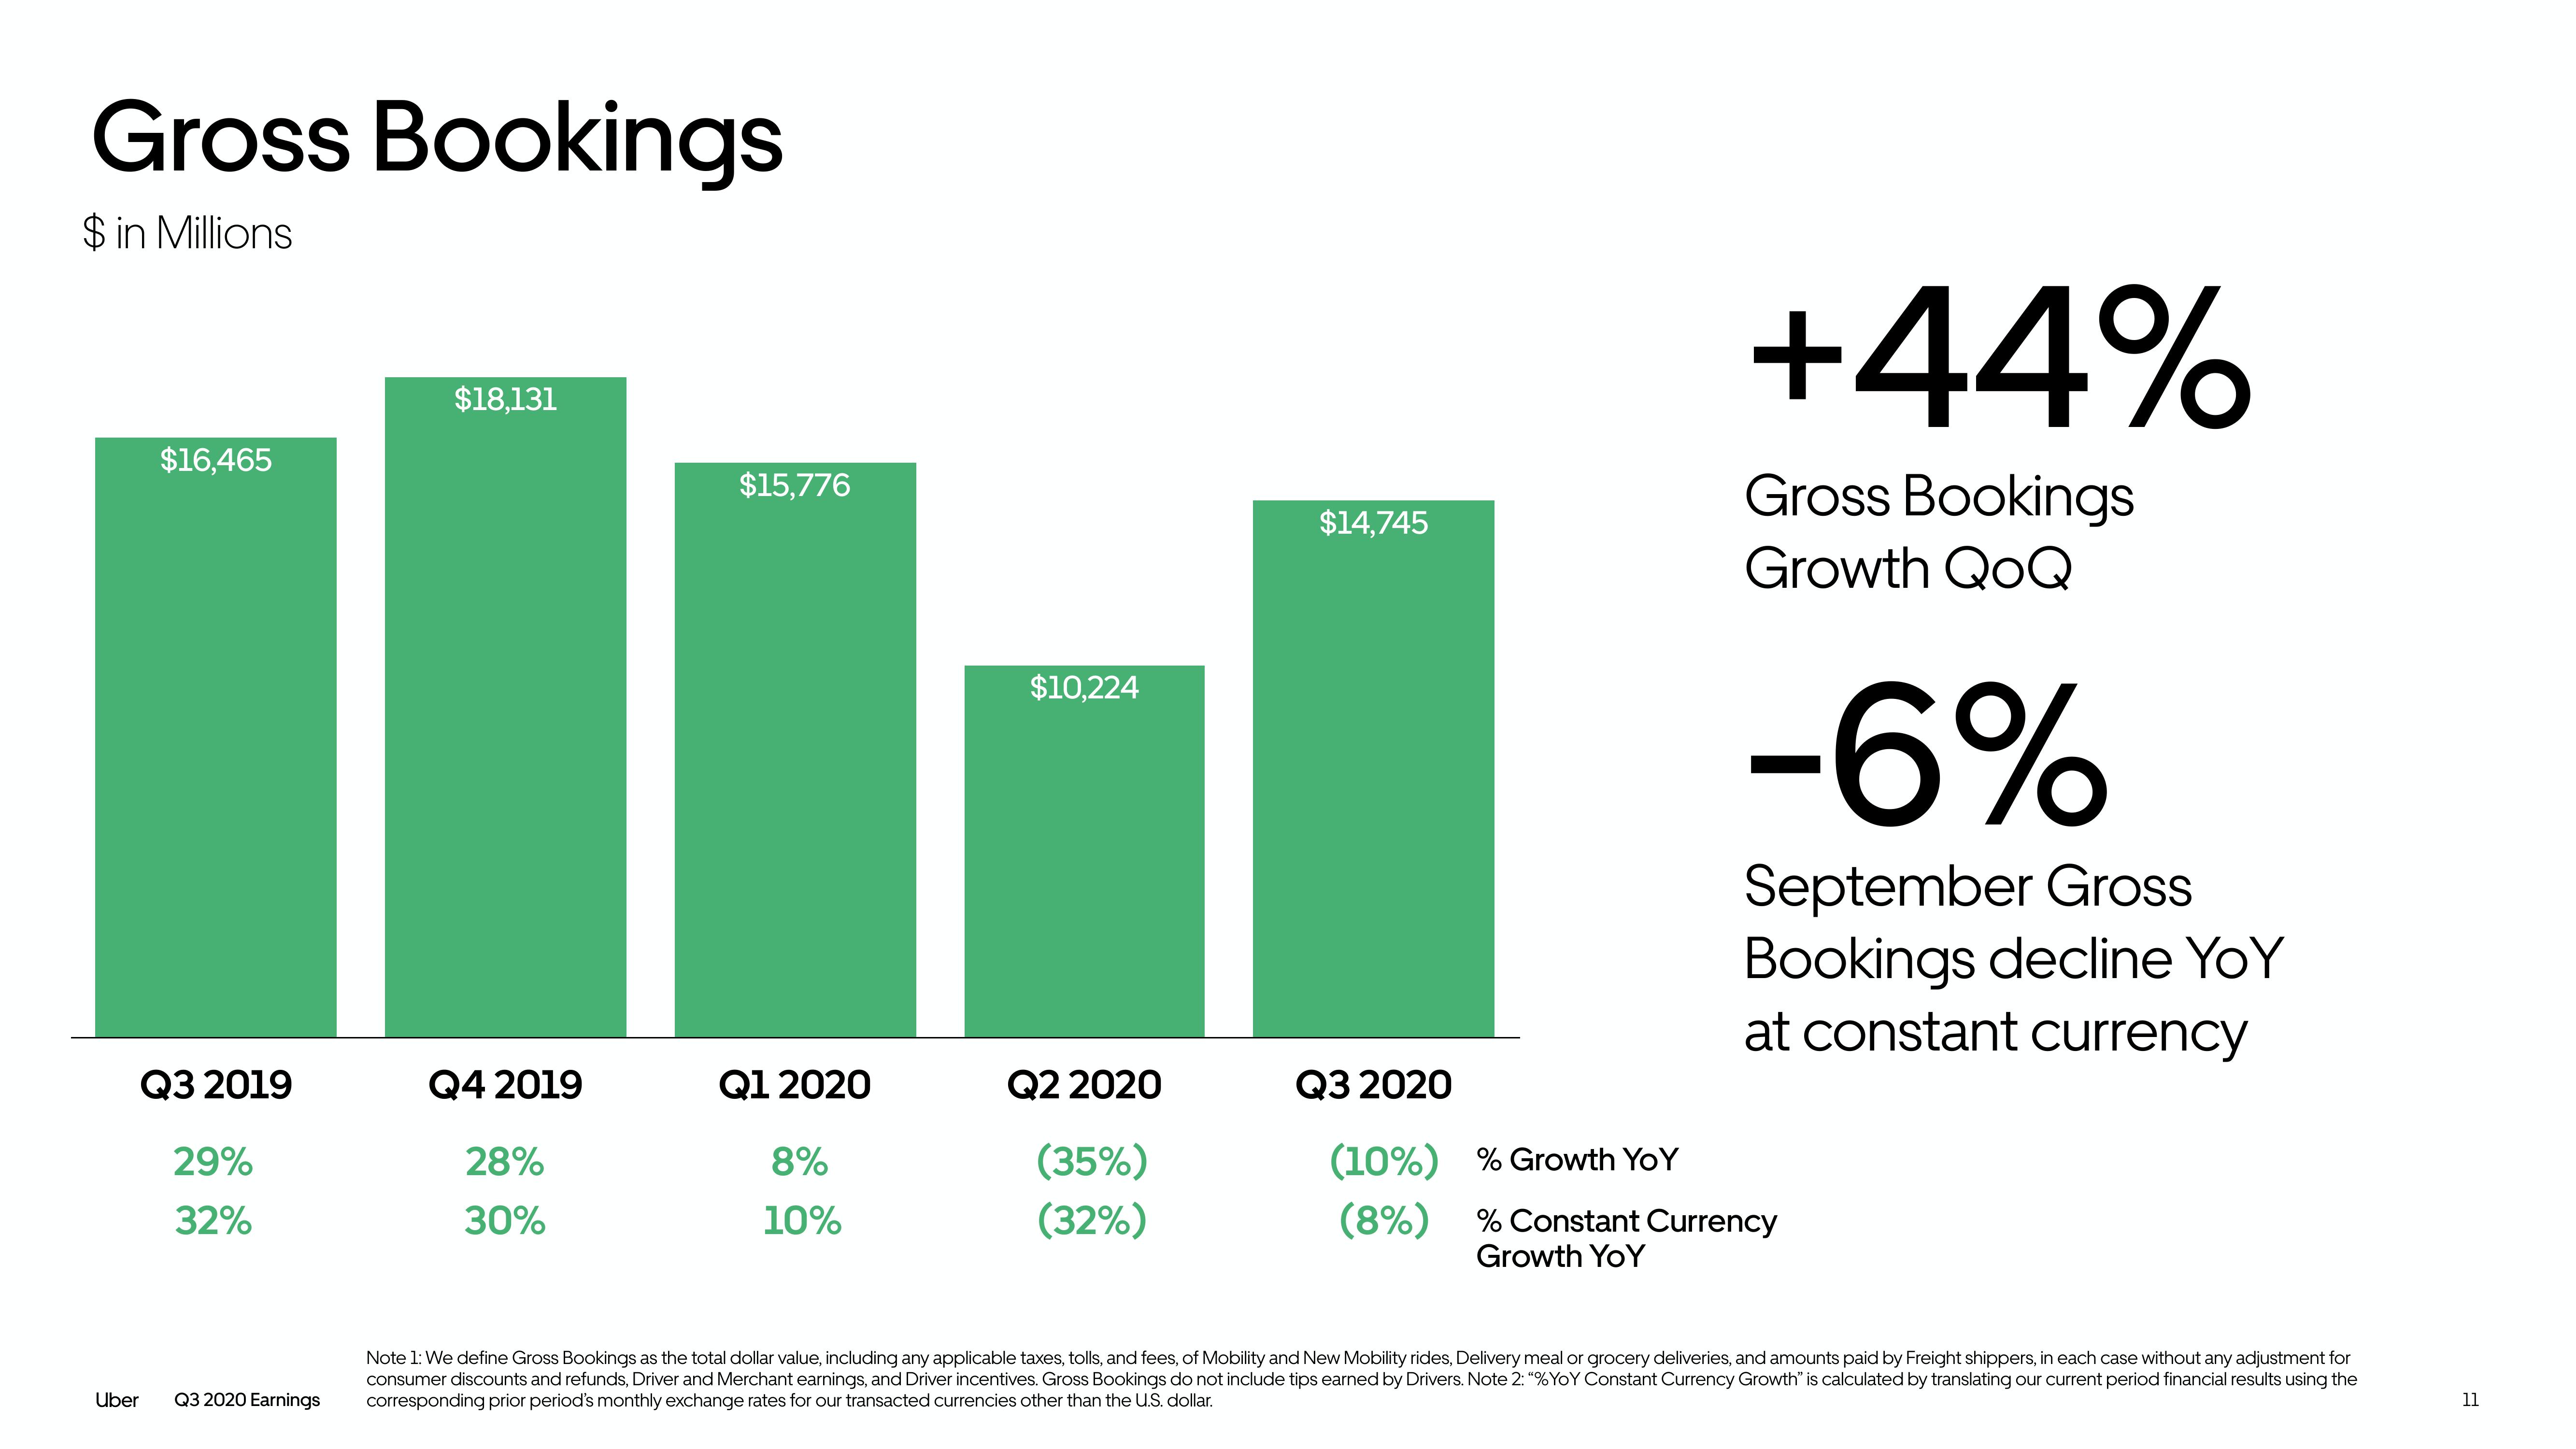
Gross Bookings
$ in Millions
Uber
$16,465
Q3 2019
29%
32%
Q3 2020 Earnings
$18,131
Q4 2019
28%
30%
$15,776
Q1 2020
8%
10%
$10,224
Q2 2020
(35%)
(32%)
$14,745
Q3 2020
(10%)
(8%)
+44%
Gross Bookings
Growth QoQ
-6%
September Gross
Bookings decline YoY
at constant currency
% Growth YoY
% Constant Currency
Growth YoY
Note 1: We define Gross Bookings as the total dollar value, including any applicable taxes, tolls, and fees, of Mobility and New Mobility rides, Delivery meal or grocery deliveries, and amounts paid by Freight shippers, in each case without any adjustment for
consumer discounts and refunds, Driver and Merchant earnings, and Driver incentives. Gross Bookings do not include tips earned by Drivers. Note 2: "%YoY Constant Currency Growth" is calculated by translating our current period financial results using the
corresponding prior period's monthly exchange rates for our transacted currencies other than the U.S. dollar.
11View entire presentation