Summer 2023 Solar Industry Update
# of Workers (000s)
U.S. Solar Workforce
(IREC)
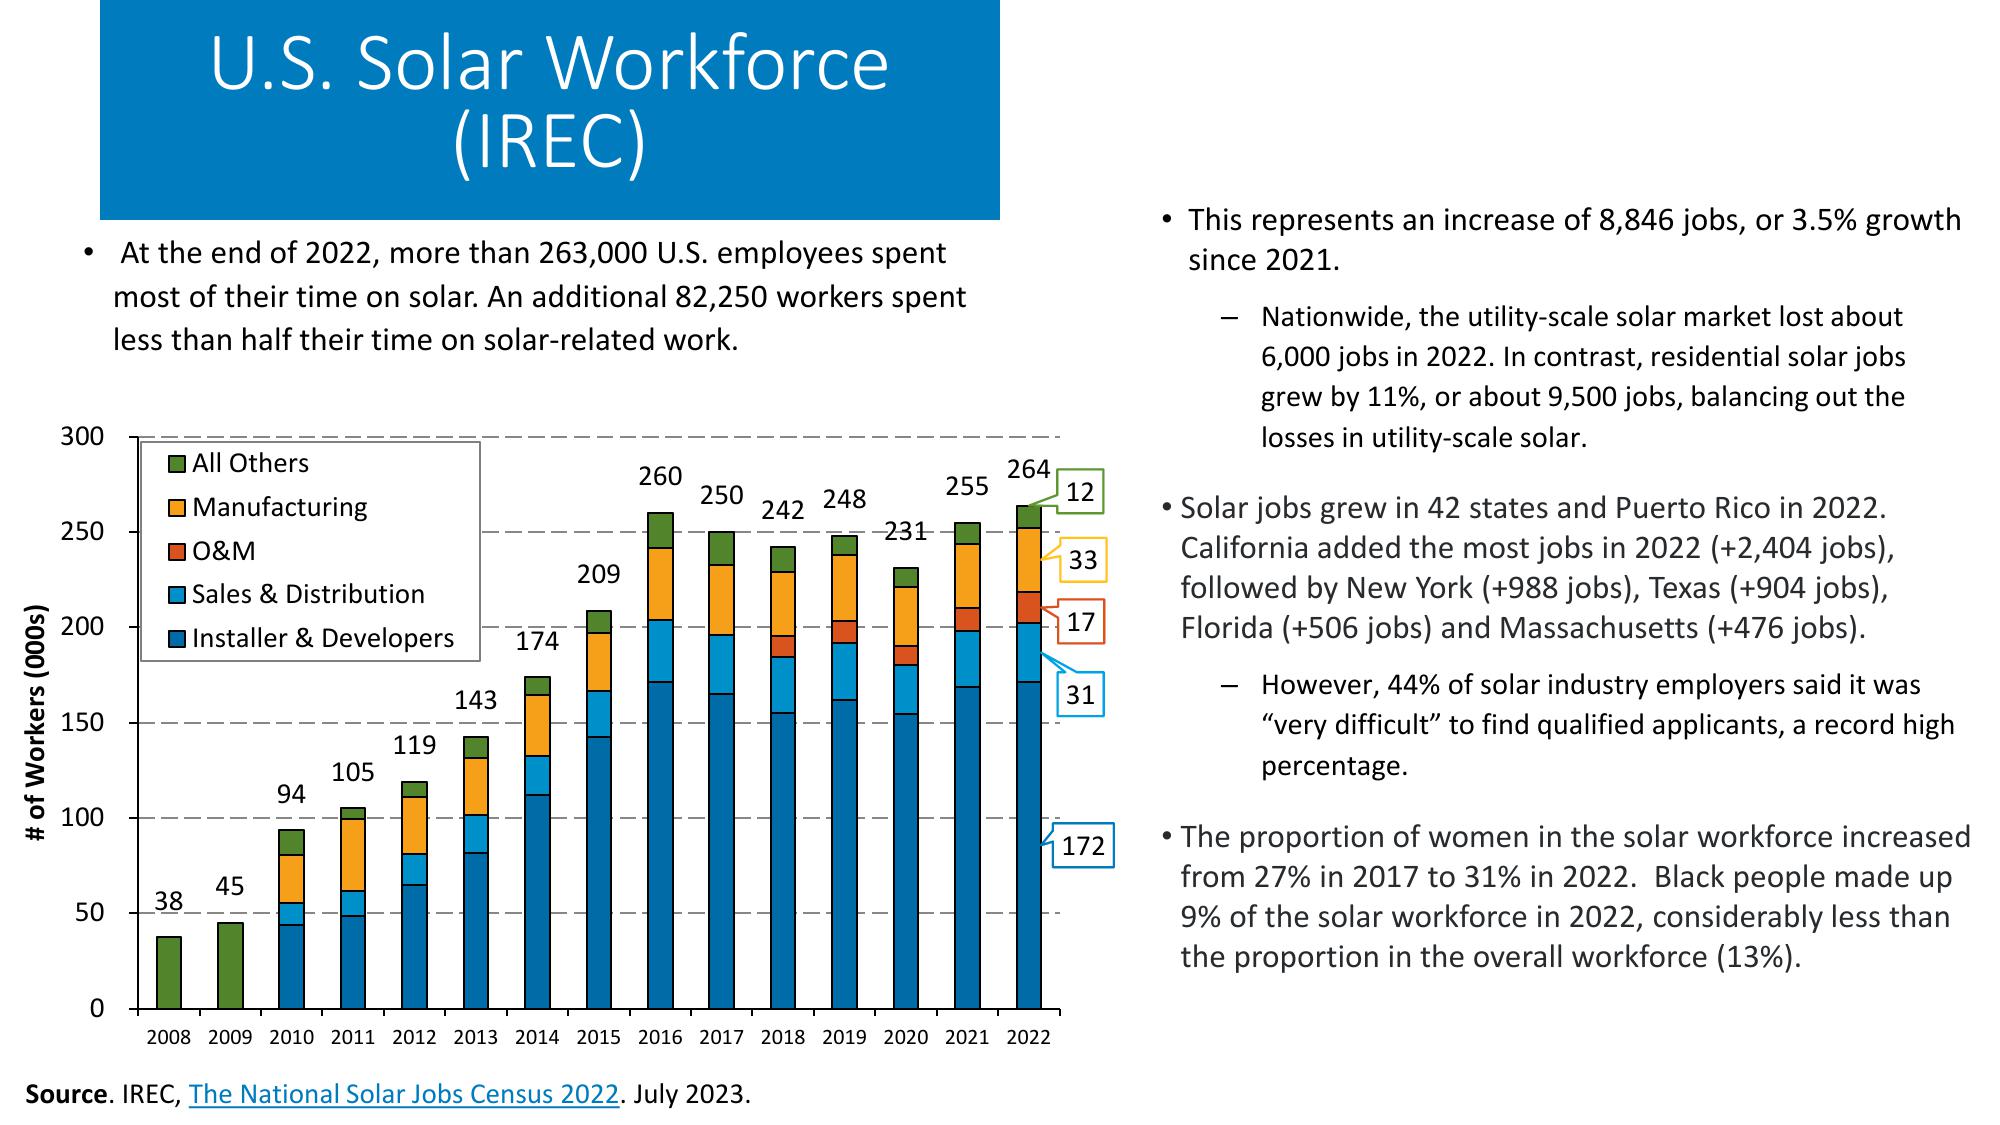
At the end of 2022, more than 263,000 U.S. employees spent
most of their time on solar. An additional 82,250 workers spent
less than half their time on solar-related work.
300
All Others
250
200
150
100
Manufacturing
□ O&M
Sales & Distribution
Installer & Developers
45
38
50
209
174
143
119
105
94
260
264
250
255
248
12
242
-231
33
17
⚫ This represents an increase of 8,846 jobs, or 3.5% growth
since 2021.
-
Nationwide, the utility-scale solar market lost about
6,000 jobs in 2022. In contrast, residential solar jobs
grew by 11%, or about 9,500 jobs, balancing out the
losses in utility-scale solar.
•Solar jobs grew in 42 states and Puerto Rico in 2022.
California added the most jobs in 2022 (+2,404 jobs),
followed by New York (+988 jobs), Texas (+904 jobs),
Florida (+506 jobs) and Massachusetts (+476 jobs).
-
31
172
•
However, 44% of solar industry employers said it was
"very difficult" to find qualified applicants, a record high
percentage.
The proportion of women in the solar workforce increased
from 27% in 2017 to 31% in 2022. Black people made up
9% of the solar workforce in 2022, considerably less than
the proportion in the overall workforce (13%).
0
2008 2009 2010 2011 2012 2013 2014 2015 2016 2017 2018 2019 2020 2021 2022
Source. IREC, The National Solar Jobs Census 2022. July 2023.View entire presentation