Snowflake Results Presentation Deck
Q3 Financial Highlights
Rapid Growth
at Scale
Significant Expansion
with Existing Customers
Strong Large
Customer Momentum
Improving Product
Gross Margin
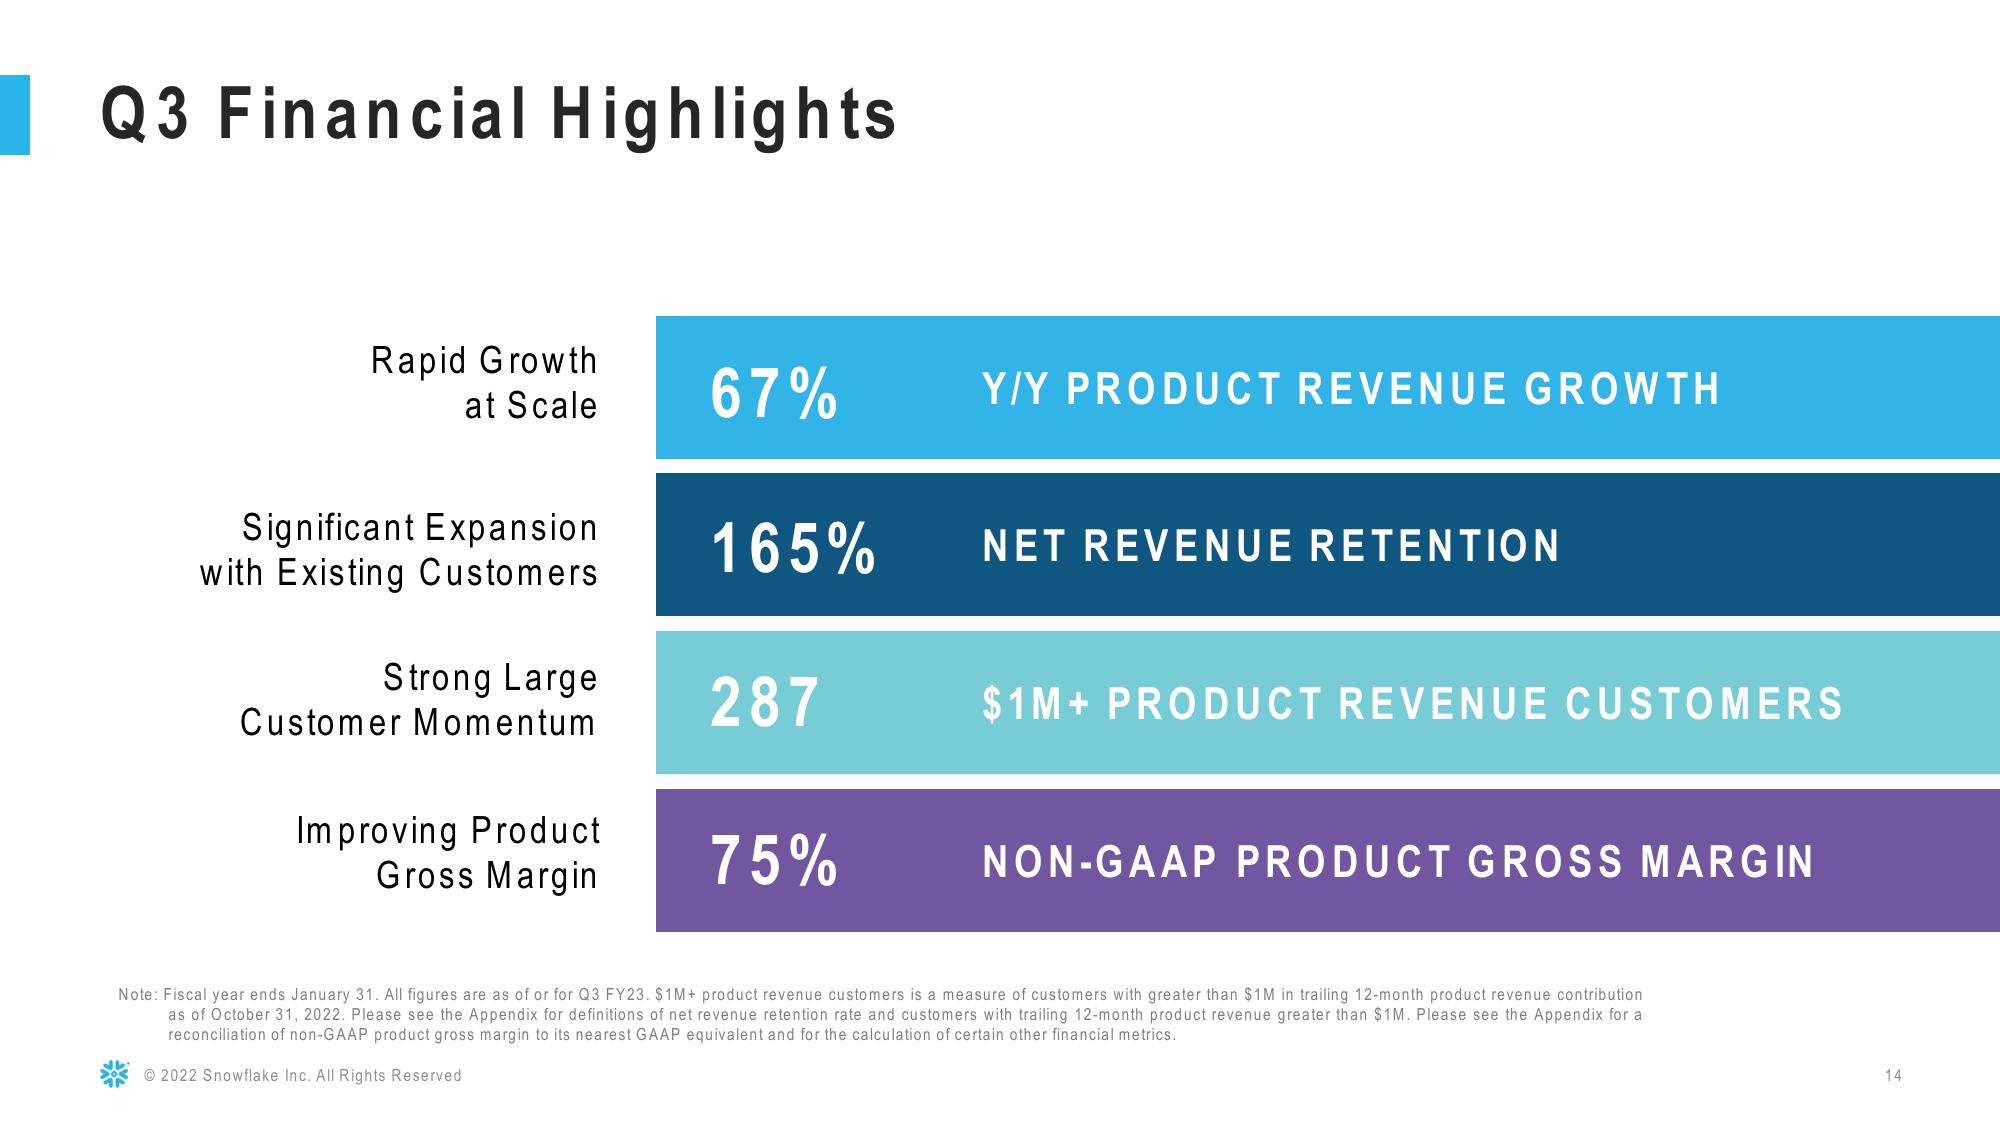
67%
165%
287
75%
Y/Y PRODUCT REVENUE GROWTH
NET REVENUE RETENTION
$1M+ PRODUCT REVENUE CUSTOMERS
NON-GAAP PRODUCT GROSS MARGIN
Note: Fiscal year ends January 31. All figures are as of or for Q3 FY23. $1M+ product revenue customers is a measure of customers with greater than $1M in trailing 12-month product revenue contribution.
as of October 31, 2022. Please see the Appendix for definitions of net revenue retention rate and customers with trailing 12-month product revenue greater than $1M. Please see the Appendix for a
reconciliation of non-GAAP product gross margin to its nearest GAAP equivalent and for the calculation of certain other financial metrics.
2022 Snowflake Inc. All Rights Reserved
14View entire presentation