Perfect SPAC Presentation Deck
PERFECT
Revenue (US$m)¹
24
31
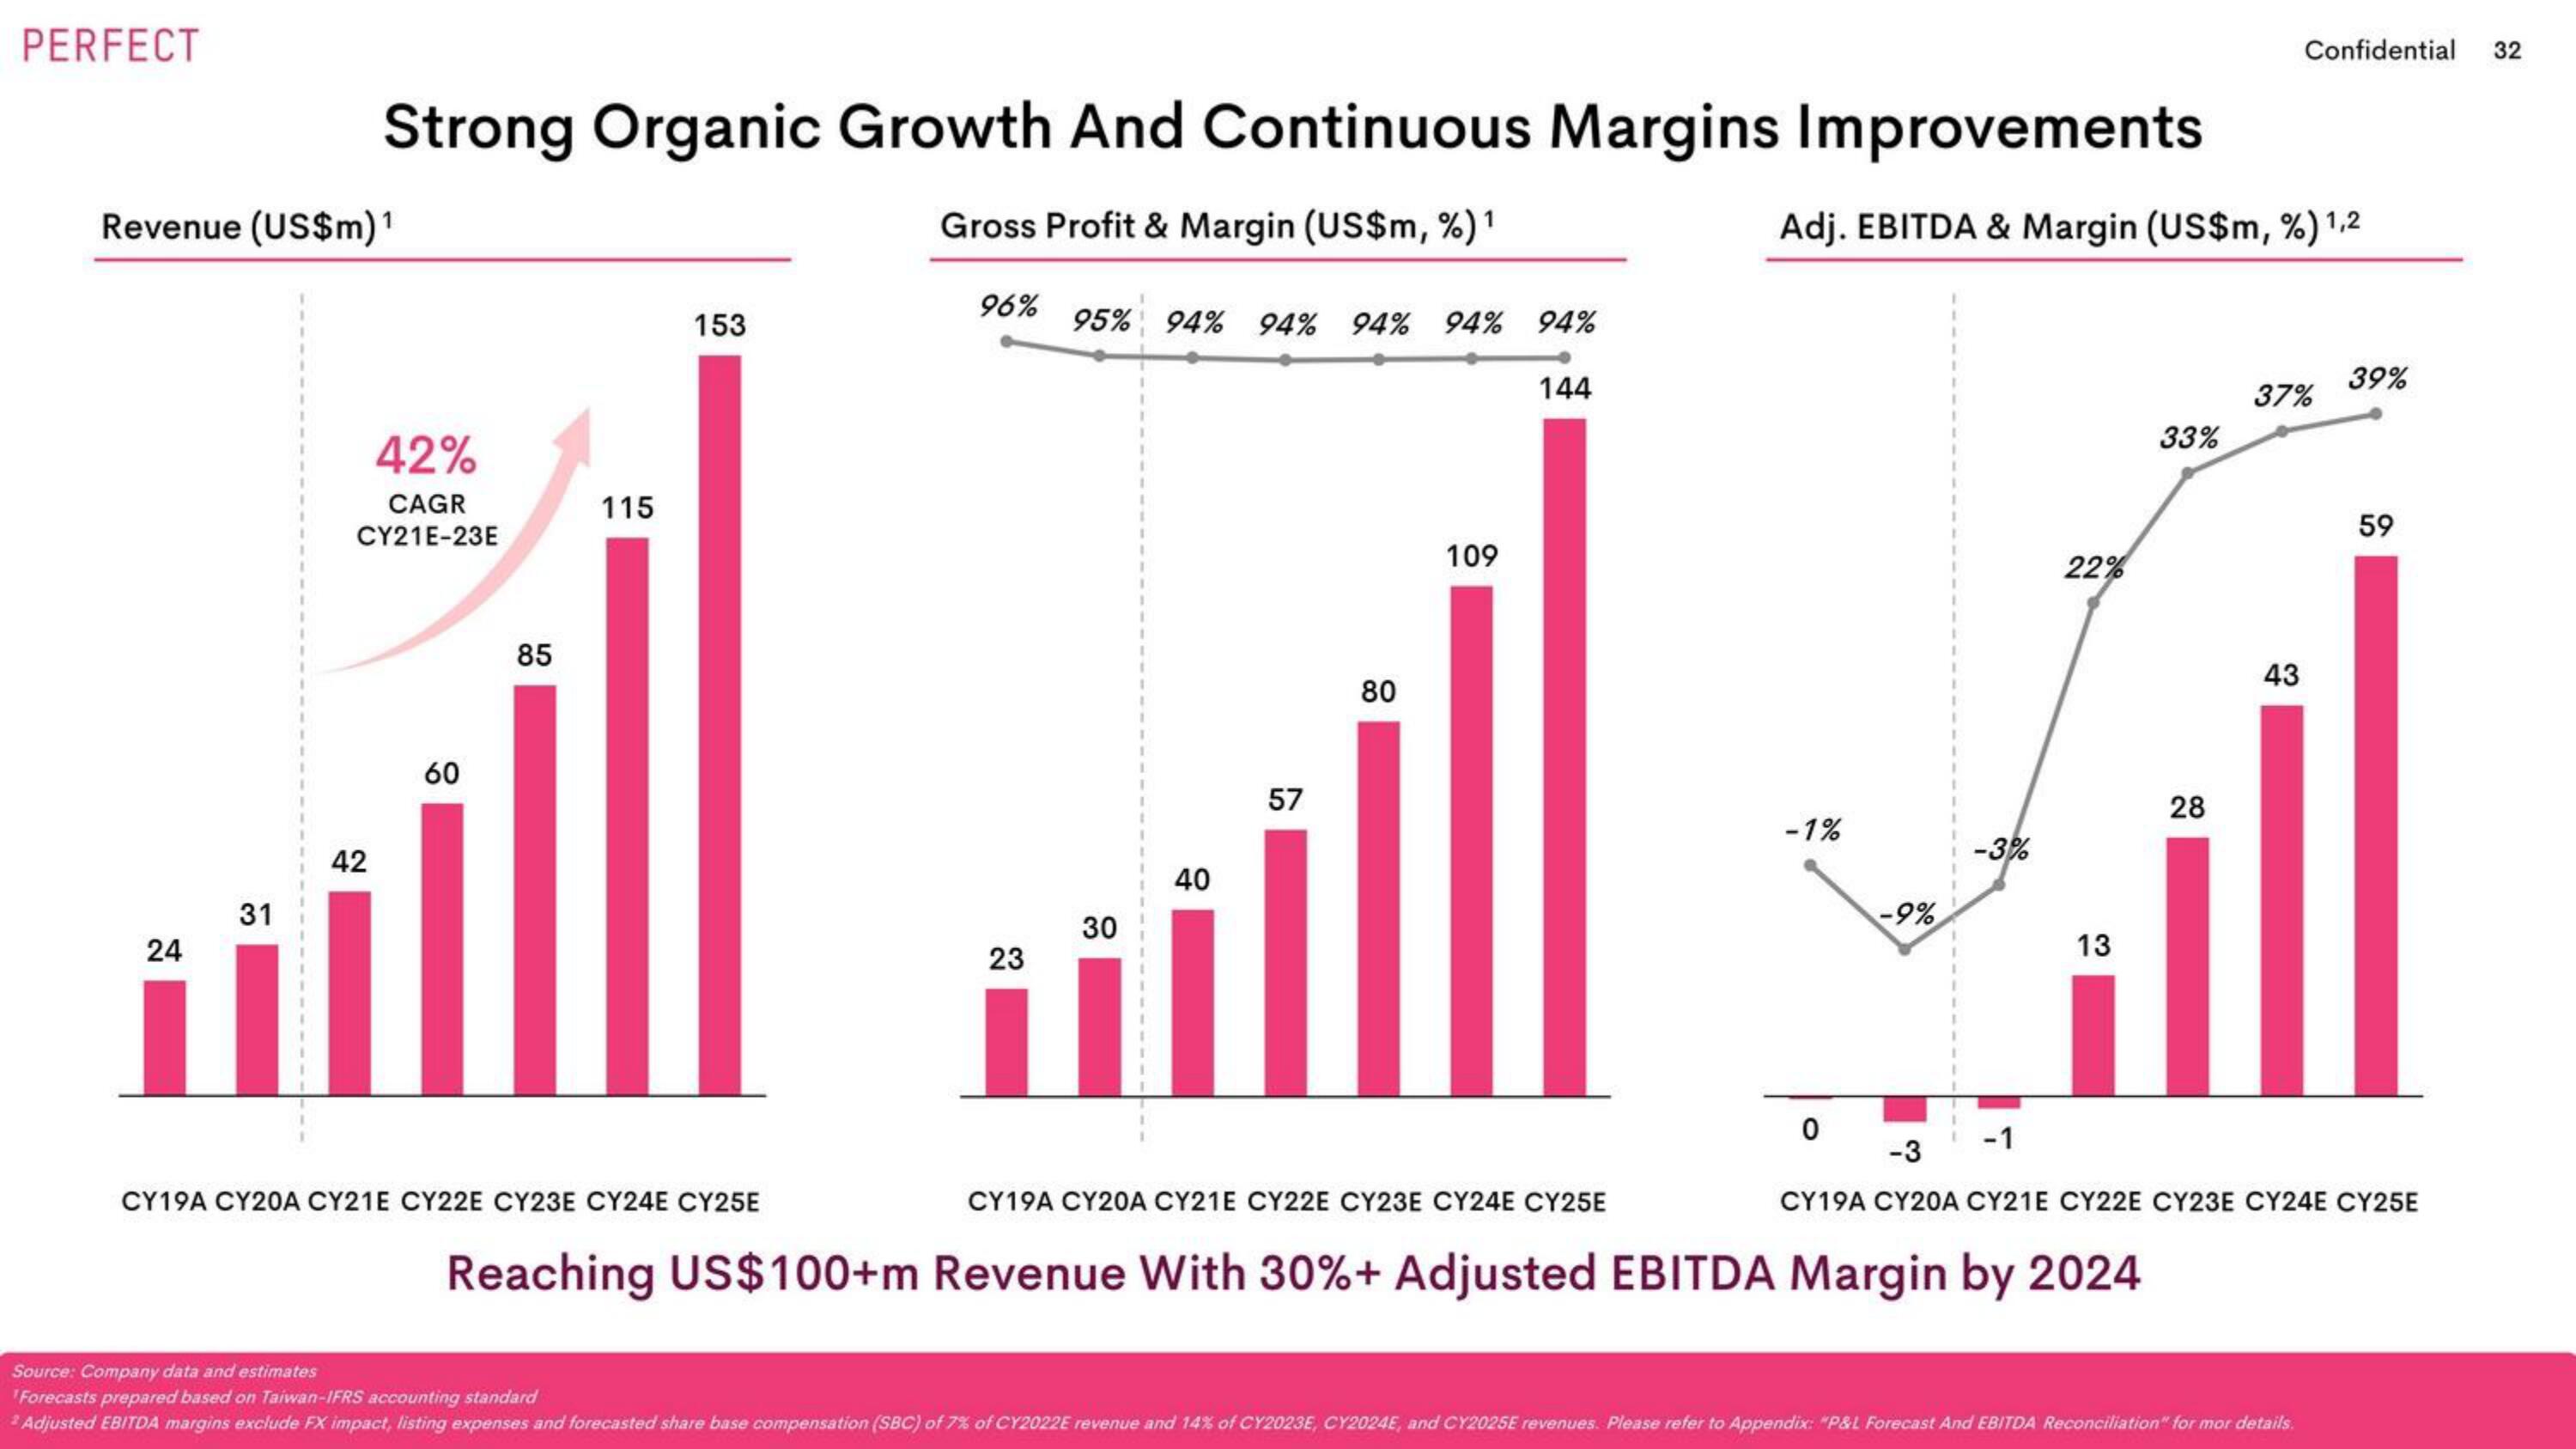
Strong Organic Growth And Continuous Margins Improvements
Gross Profit & Margin (US$m, %) ¹
Adj. EBITDA & Margin (US$m, %) 1,2
42%
CAGR
CY21E-23E
42
60
85
115
153
CY19A CY20A CY21E CY22E CY23E CY24E CY25E
96%
23
95% 94% 94% 94% 94% 94%
30
40
57
80
109
144
-1%
0
-9%
-3%
22%
13
CY19A CY20A CY21E CY22E CY23E CY24E CY25E
Reaching US$100+m Revenue With 30% + Adjusted EBITDA Margin by 2024
33%
28
Confidential 32
37%
43
Source: Company data and estimates
Forecasts prepared based on Taiwan-IFRS accounting standard
2 Adjusted EBITDA margins exclude FX impact, listing expenses and forecasted share base compensation (SBC) of 7% of CY2022E revenue and 14% of CY2023E, CY2024E, and CY2025E revenues. Please refer to Appendix: "P&L Forecast And EBITDA Reconciliation for mor details.
39%
-1
-3
CY19A CY20A CY21E CY22E CY23E CY24E CY25E
59View entire presentation