Grab Results Presentation Deck
Q3 2021 Results
Financial services
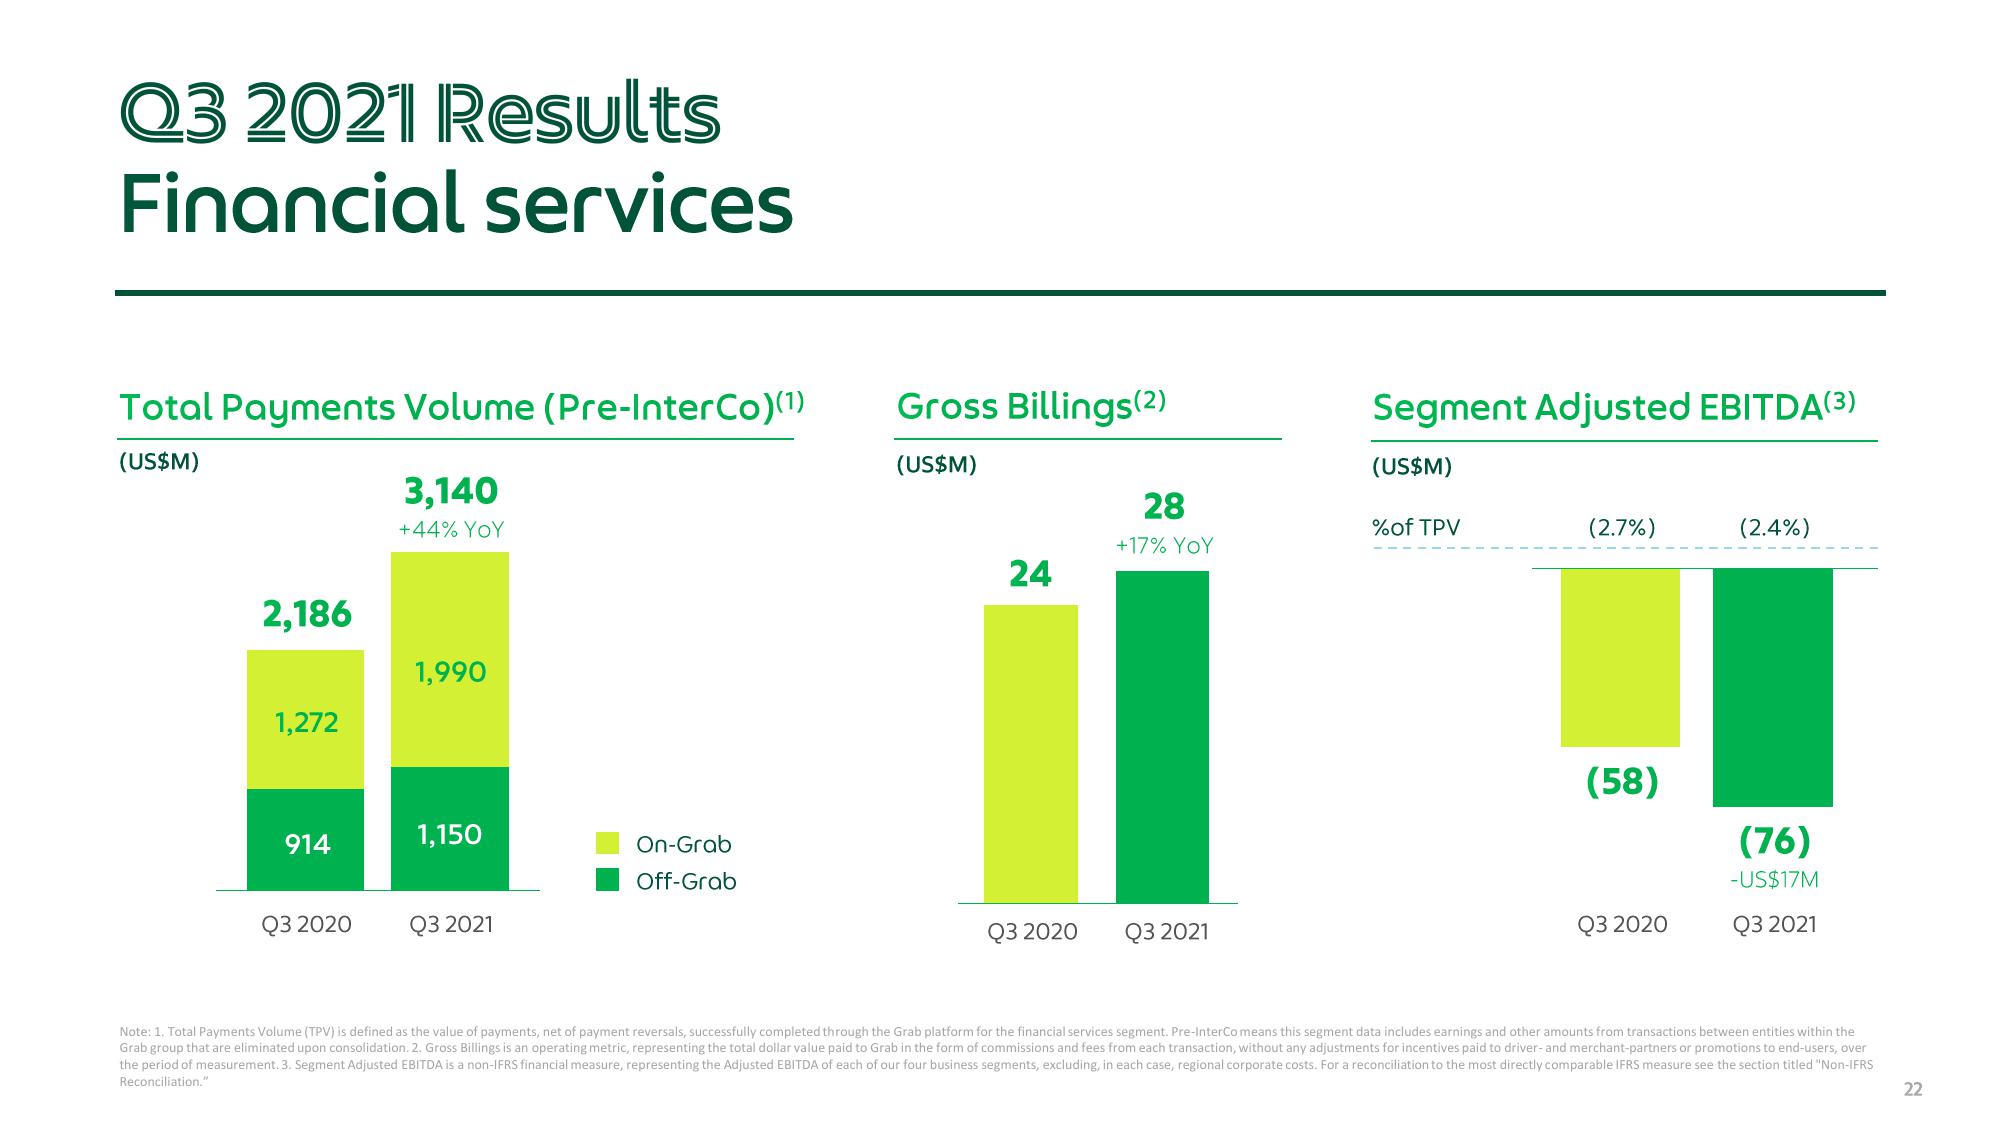
Total Payments Volume (Pre-InterCo)(¹)
(US$M)
2,186
1,272
914
Q3 2020
3,140
+44% YOY
1,990
1,150
Q3 2021
On-Grab
Off-Grab
Gross Billings (2)
(US$M)
24
Q3 2020
28
+17% YOY
Q3 2021
Segment Adjusted EBITDA(3)
(US$M)
%of TPV
(2.7%)
(58)
Q3 2020
(2.4%)
(76)
-US$17M
Q3 2021
Note: 1. Total Payments Volume (TPV) is defined as the value of payments, net of payment reversals, successfully completed through the Grab platform for the financial services segment. Pre-InterCo means this segment data includes earnings and other amounts from transactions between entities within the
Grab group that are eliminated upon consolidation. 2. Gross Billings is an operating metric, representing the total dollar value paid to Grab in the form of commissions and fees from each transaction, without any adjustments for incentives paid to driver- and merchant-partners or promotions to end-users, over
the period of measurement. 3. Segment Adjusted EBITDA is a non-IFRS financial measure, representing the Adjusted EBITDA of each of our four business segments, excluding, in each case, regional corporate costs. For a reconciliation to the most directly comparable IFRS measure see the section titled "Non-IFRS
Reconciliation."
22View entire presentation