Bank of America Results Presentation Deck
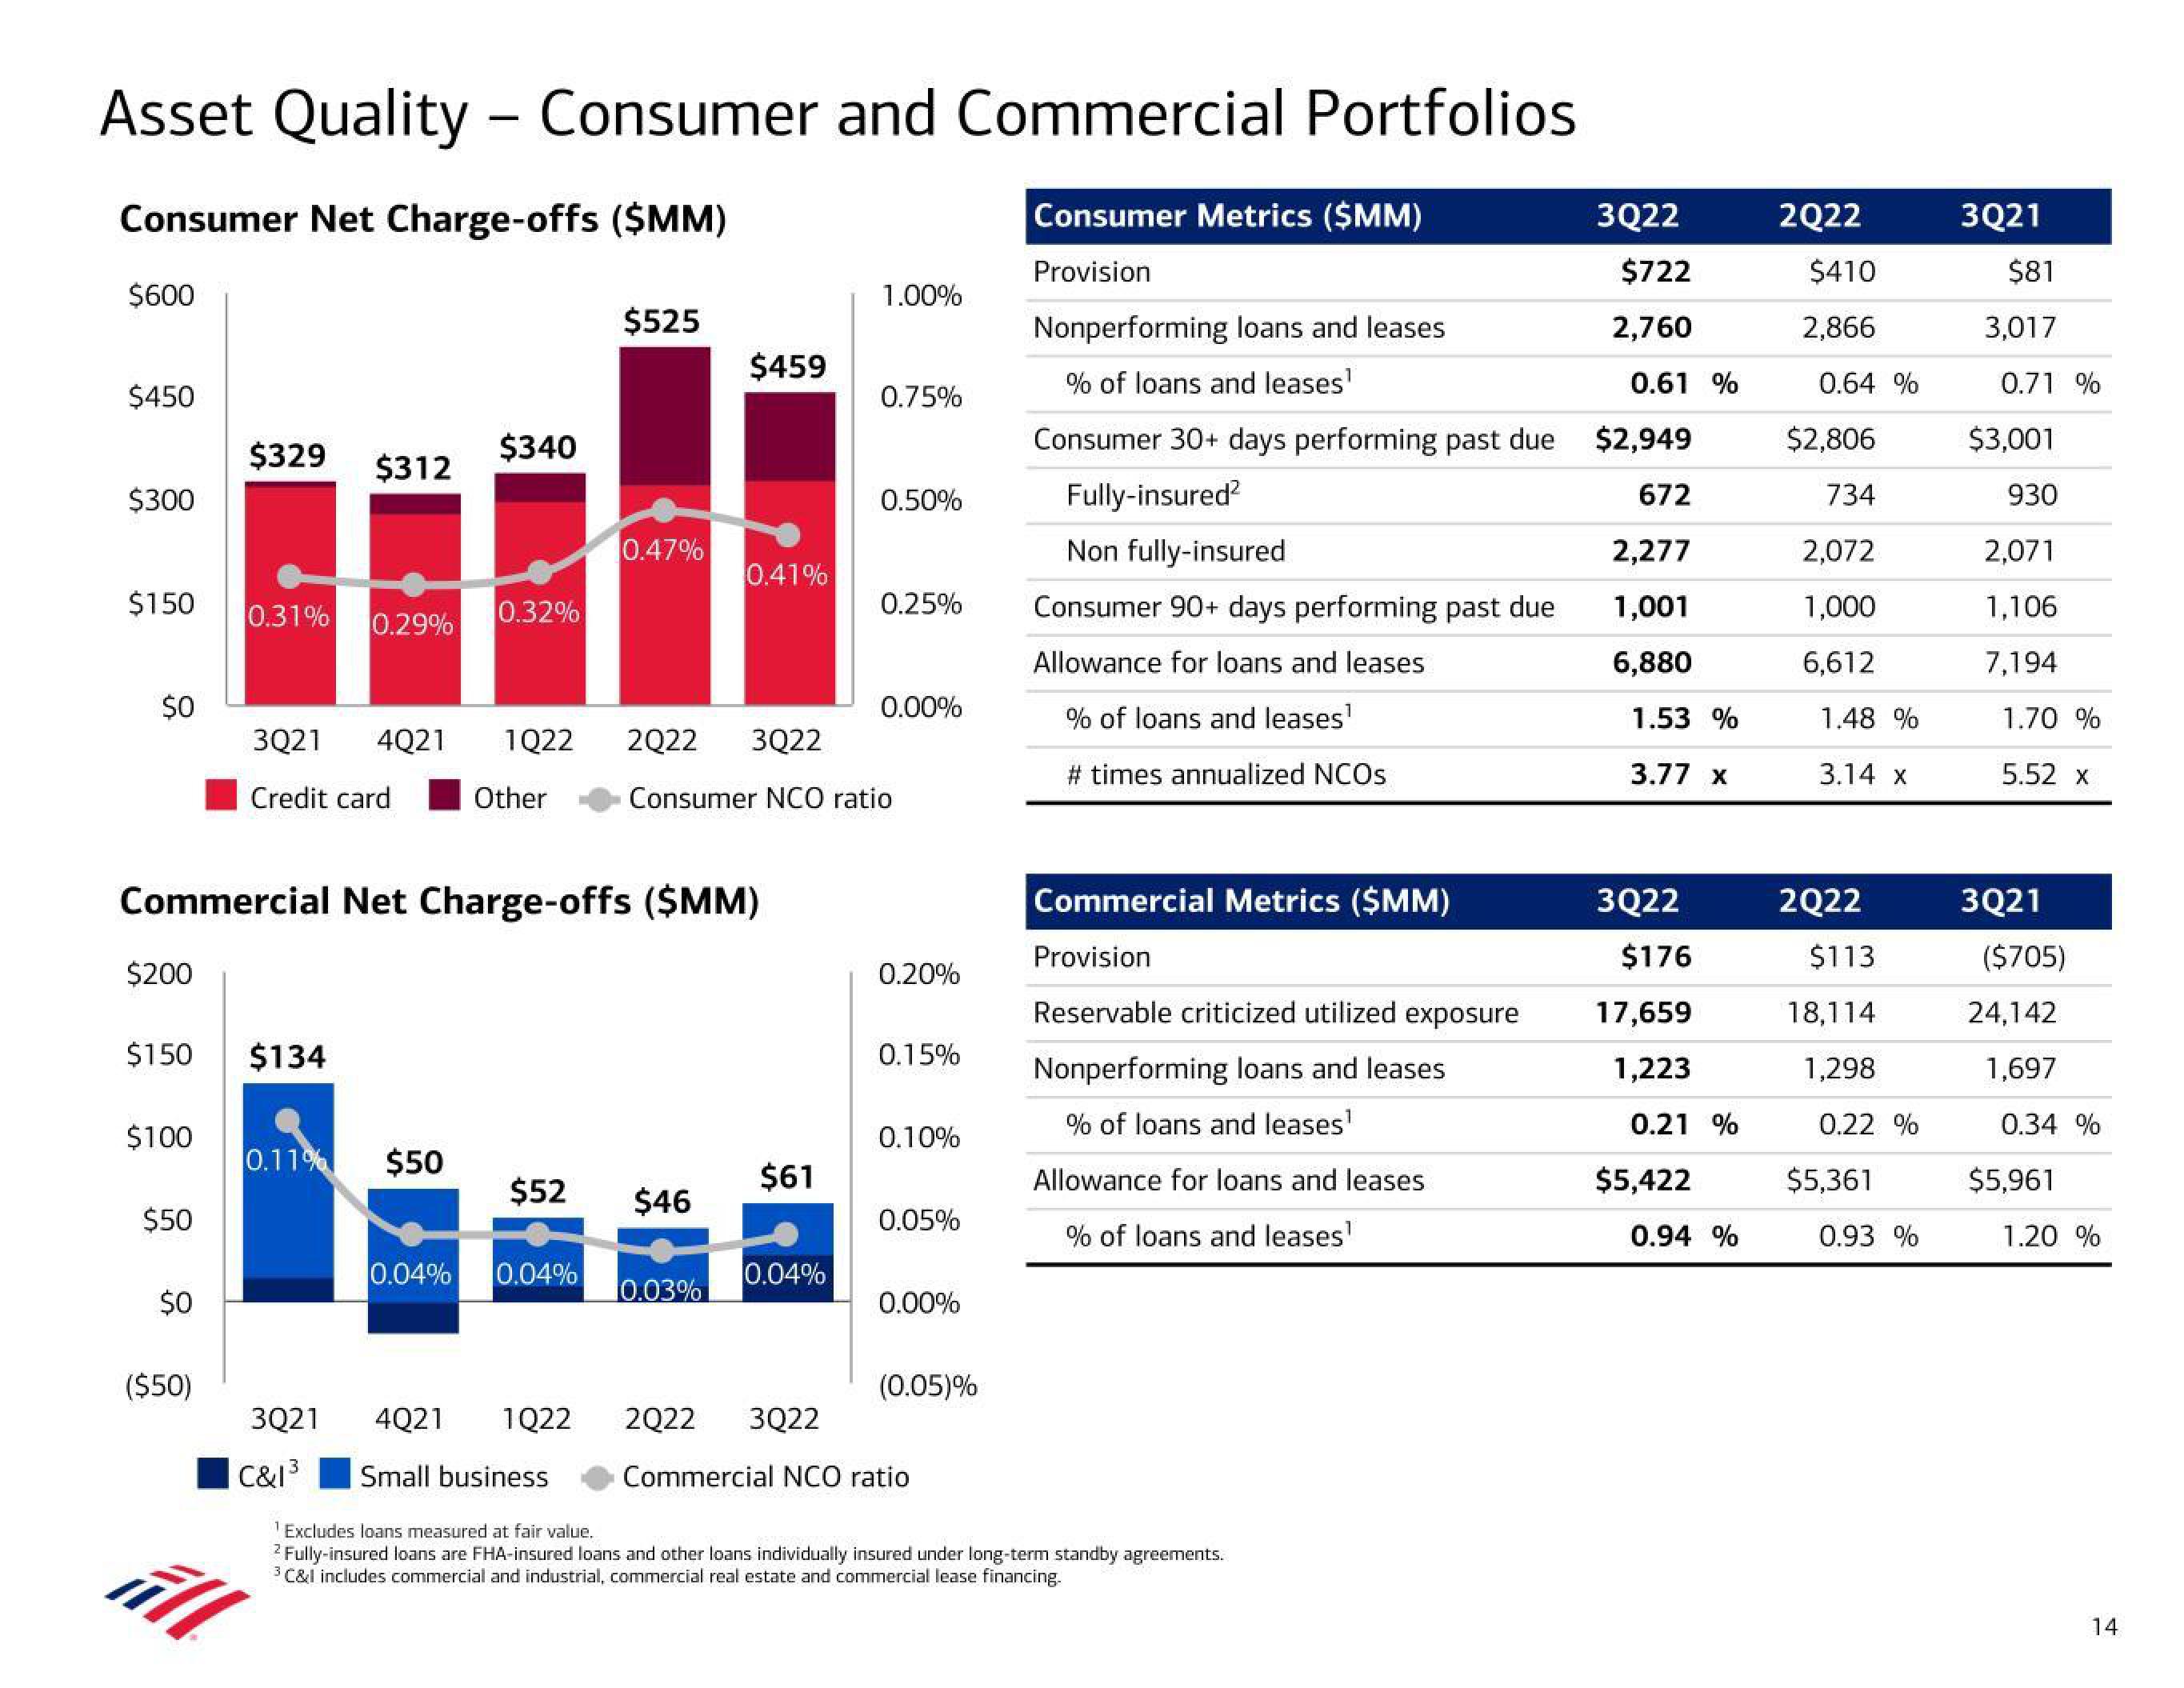
Asset Quality - Consumer and Commercial Portfolios
Consumer Net Charge-offs ($MM)
Consumer Metrics ($MM)
Provision
$600
$450
$300
$150
$0
$200
$150
$100
$50
$0
($50)
$329
0.31%
ill
$312
0.29%
$134
Commercial Net Charge-offs ($MM)
$340
0.11% $50
0.32%
3Q21 4Q21 1Q22 2Q22 3Q22
Credit card
Other
$52
$525
0.04% 0.04%
4Q21 1Q22
3Q21
C&1³ Small business
0.47%
$459
0.41%
$46
10.03%
$61
1.00%
Consumer NCO ratio
0.04%
0.75%
0.50%
0.25%
0.00%
0.20%
0.15%
0.10%
0.05%
0.00%
(0.05)%
2Q22 3Q22
Commercial NCO ratio
Nonperforming loans and leases
% of loans and leases¹
Consumer 30+ days performing past due
Fully-insured²
Non fully-insured
Consumer 90+ days performing past due
Allowance for loans and leases
% of loans and leases¹
# times annualized NCOs
Commercial Metrics ($MM)
Provision
Reservable criticized utilized exposure
Nonperforming loans and leases
% of loans and leases¹
Allowance for loans and leases
% of loans and leases¹
¹Excludes loans measured at fair value.
2 Fully-insured loans are FHA-insured loans and other loans individually insured under long-term standby agreements.
³ C&I includes commercial and industrial, commercial real estate and commercial lease financing.
3Q22
$722
2,760
0.61 %
$2,949
672
2,277
1,001
6,880
1.53 %
3.77 x
3Q22
$176
17,659
1,223
0.21 %
$5,422
0.94 %
2Q22
$410
2,866
0.64 %
$2,806
734
2,072
1,000
6,612
1.48 %
3.14 Xx
2Q22
$113
18,114
1,298
0.22 %
$5,361
0.93 %
3Q21
$81
3,017
0.71 %
$3,001
930
2,071
1,106
7,194
1.70 %
5.52 x
3Q21
($705)
24,142
1,697
0.34 %
$5,961
1.20 %
14View entire presentation