Sterling Results Presentation Deck
11
Our Global Presence
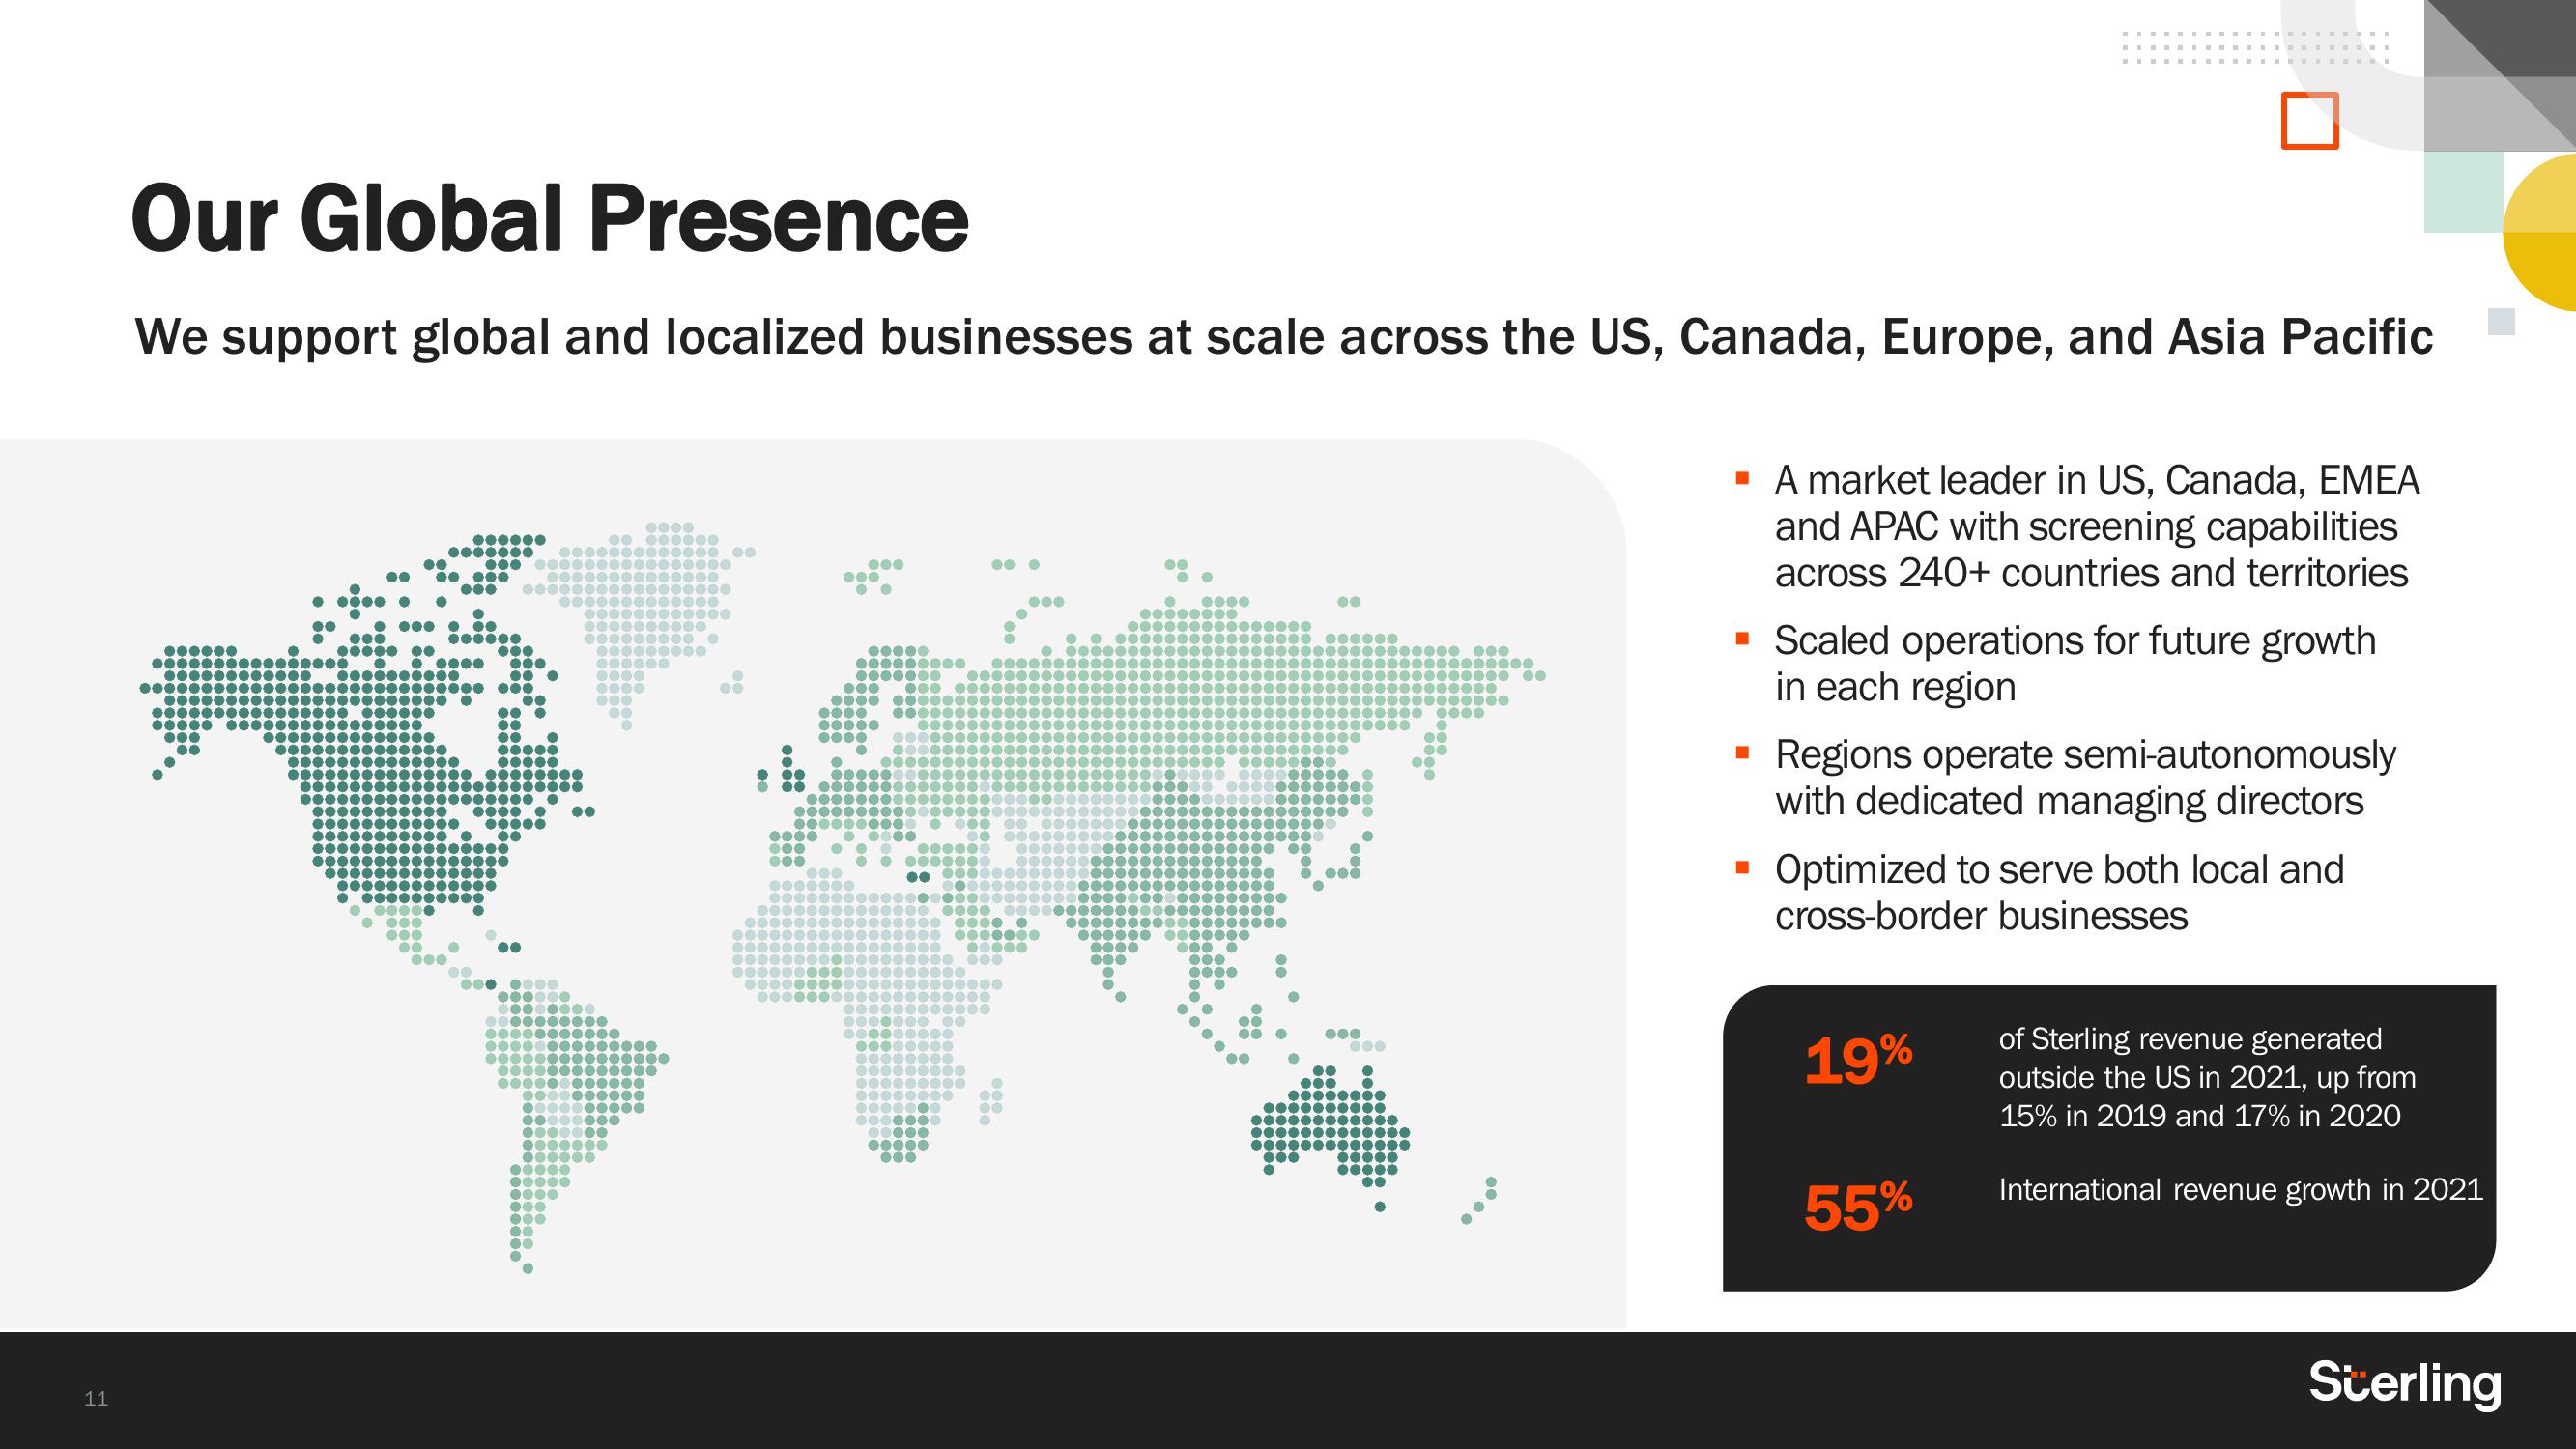
We support global and localized businesses at scale across the US, Canada, Europe, and Asia Pacific
●●●●● ●
●●
000000
●●
00000
0000
●●●●●●●
●●●
00000 00
000
● ● ●●●●● ●●●
●●●●●●●●●●
●●●
●●●●●●●●●●●●●
000
000
00
●000000000
000000
●
00.000
000000
000
●
●●●
●●●●●●
000
●●●
●●
●●
000 00000000
000000000000
●●●●●●●●●
00000
0000
00
00000
00000
000
●●●●●
●●●●●
●●●●●●
00000
00000
●●
000 0000
000000
00000000
●●
0000000
000000000
00000
00000
0000
00000000
0000000
2000000
00000000
0000000
0000000000
0000000
0000 0
000
●
000000000000
●●●
●●
●●
00000000
000000
0000
00000000
0000000
0000000
000000
000000
0000000000000
0000000000000
00000000000
0000000000
0000000000
●●
000
00000
00000000
0000000
000
000
90 0000
000
00000
0000
0000
0000000
000000000
0000000
000000000
0000
100000
000000
000000
10000000
000000000
00000000000
0000000000
00000000
00000000000
0000000000
00 00000
0000000
●●●
00000000
00000
●00000000
00000
000000000
●0000000
0000000
0000000
00000
000
00
000
00
00
•
0000
0000
0000 0
0000000000
●●●●●●●●●●●
0.0000000000
000000000
00000000
00
00000
0000000 0.000
000000000
000000000
00
000000000
●●●●●00000
0000000
000 0
000
0000
●●
●●
●●
●●
000
0000
●00 00000
0000000000
00000000000
00000000
00000000
0000
●
●●
00
00
●
▪ A market leader in US, Canada, EMEA
and APAC with screening capabilities
across 240+ countries and territories
■ Scaled operations for future growth
in each region
Regions operate semi-autonomously
with dedicated managing directors
▪ Optimized to serve both local and
cross-border businesses
19%
55%
of Sterling revenue generated
outside the US in 2021, up from
15% in 2019 and 17% in 2020
International revenue growth in 2021
SterlingView entire presentation