Deutsche Bank Results Presentation Deck
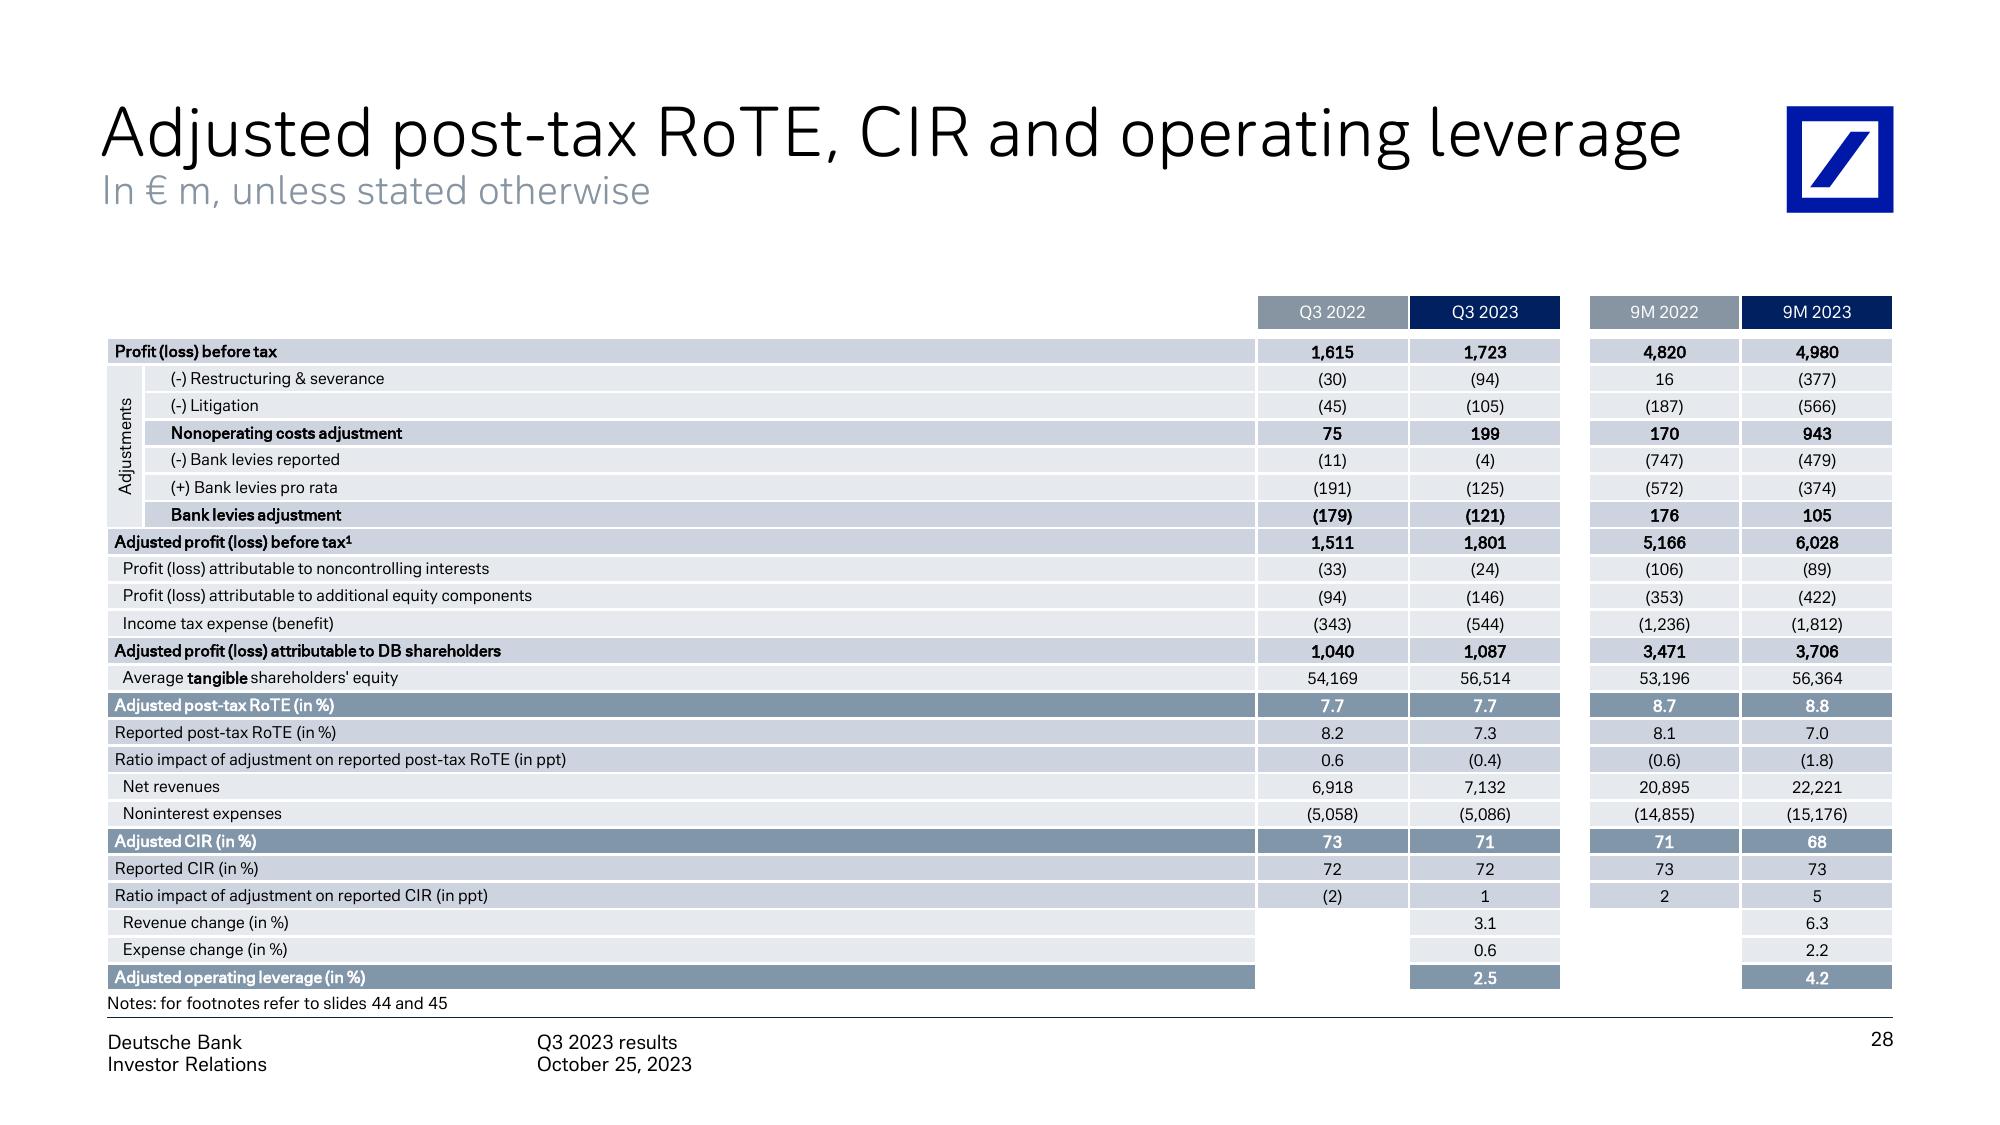
Adjusted post-tax RoTE, CIR and operating leverage
In € m, unless stated otherwise
Profit (loss) before tax
(-) Restructuring & severance
(-) Litigation
Nonoperating costs adjustment
(-) Bank levies reported
(+) Bank levies pro rata
Bank levies adjustment
Adjusted profit (loss) before tax¹
Profit (loss) attributable to noncontrolling interests
Profit (loss) attributable to additional equity components
Income tax expense (benefit)
Adjusted profit (loss) attributable to DB shareholders
Average tangible shareholders' equity
Adjustments
Adjusted post-tax ROTE (in %)
Reported post-tax ROTE (in %)
Ratio impact of adjustment on reported post-tax ROTE (in ppt)
Net revenues
Noninterest expenses
Adjusted CIR (in %)
Reported CIR (in %)
Ratio impact of adjustment on reported CIR (in ppt)
Revenue change (in %)
Expense change (in %)
Adjusted operating leverage (in %)
Notes: for footnotes refer to slides 44 and 45
Deutsche Bank
Investor Relations
Q3 2023 results
October 25, 2023
Q3 2022
1,615
(30)
(45)
75
(11)
(191)
(179)
1,511
(33)
(94)
(343)
1,040
54,169
7.7
8.2
0.6
6,918
(5,058)
73
72
(2)
Q3 2023
1,723
(94)
(105)
199
(4)
(125)
(121)
1,801
(24)
(146)
(544)
1,087
56,514
7.7
7.3
(0.4)
7,132
(5,086)
71
72
1
3.1
0.6
2.5
9M 2022
4,820
16
(187)
170
(747)
(572)
176
5,166
(106)
(353)
(1,236)
3,471
53,196
8.7
8.1
(0.6)
20,895
(14,855)
71
73
2
/
9M 2023
4,980
(377)
(566)
943
(479)
(374)
105
6,028
(89)
(422)
(1,812)
3,706
56,364
8.8
7.0
(1.8)
22,221
(15,176)
68
73
5
6.3
2.2
4.2
28View entire presentation