Telia Company Results Presentation Deck
LED MARKETS
Lithuania
Reported currency, in millions, like for like growth
+5.5%
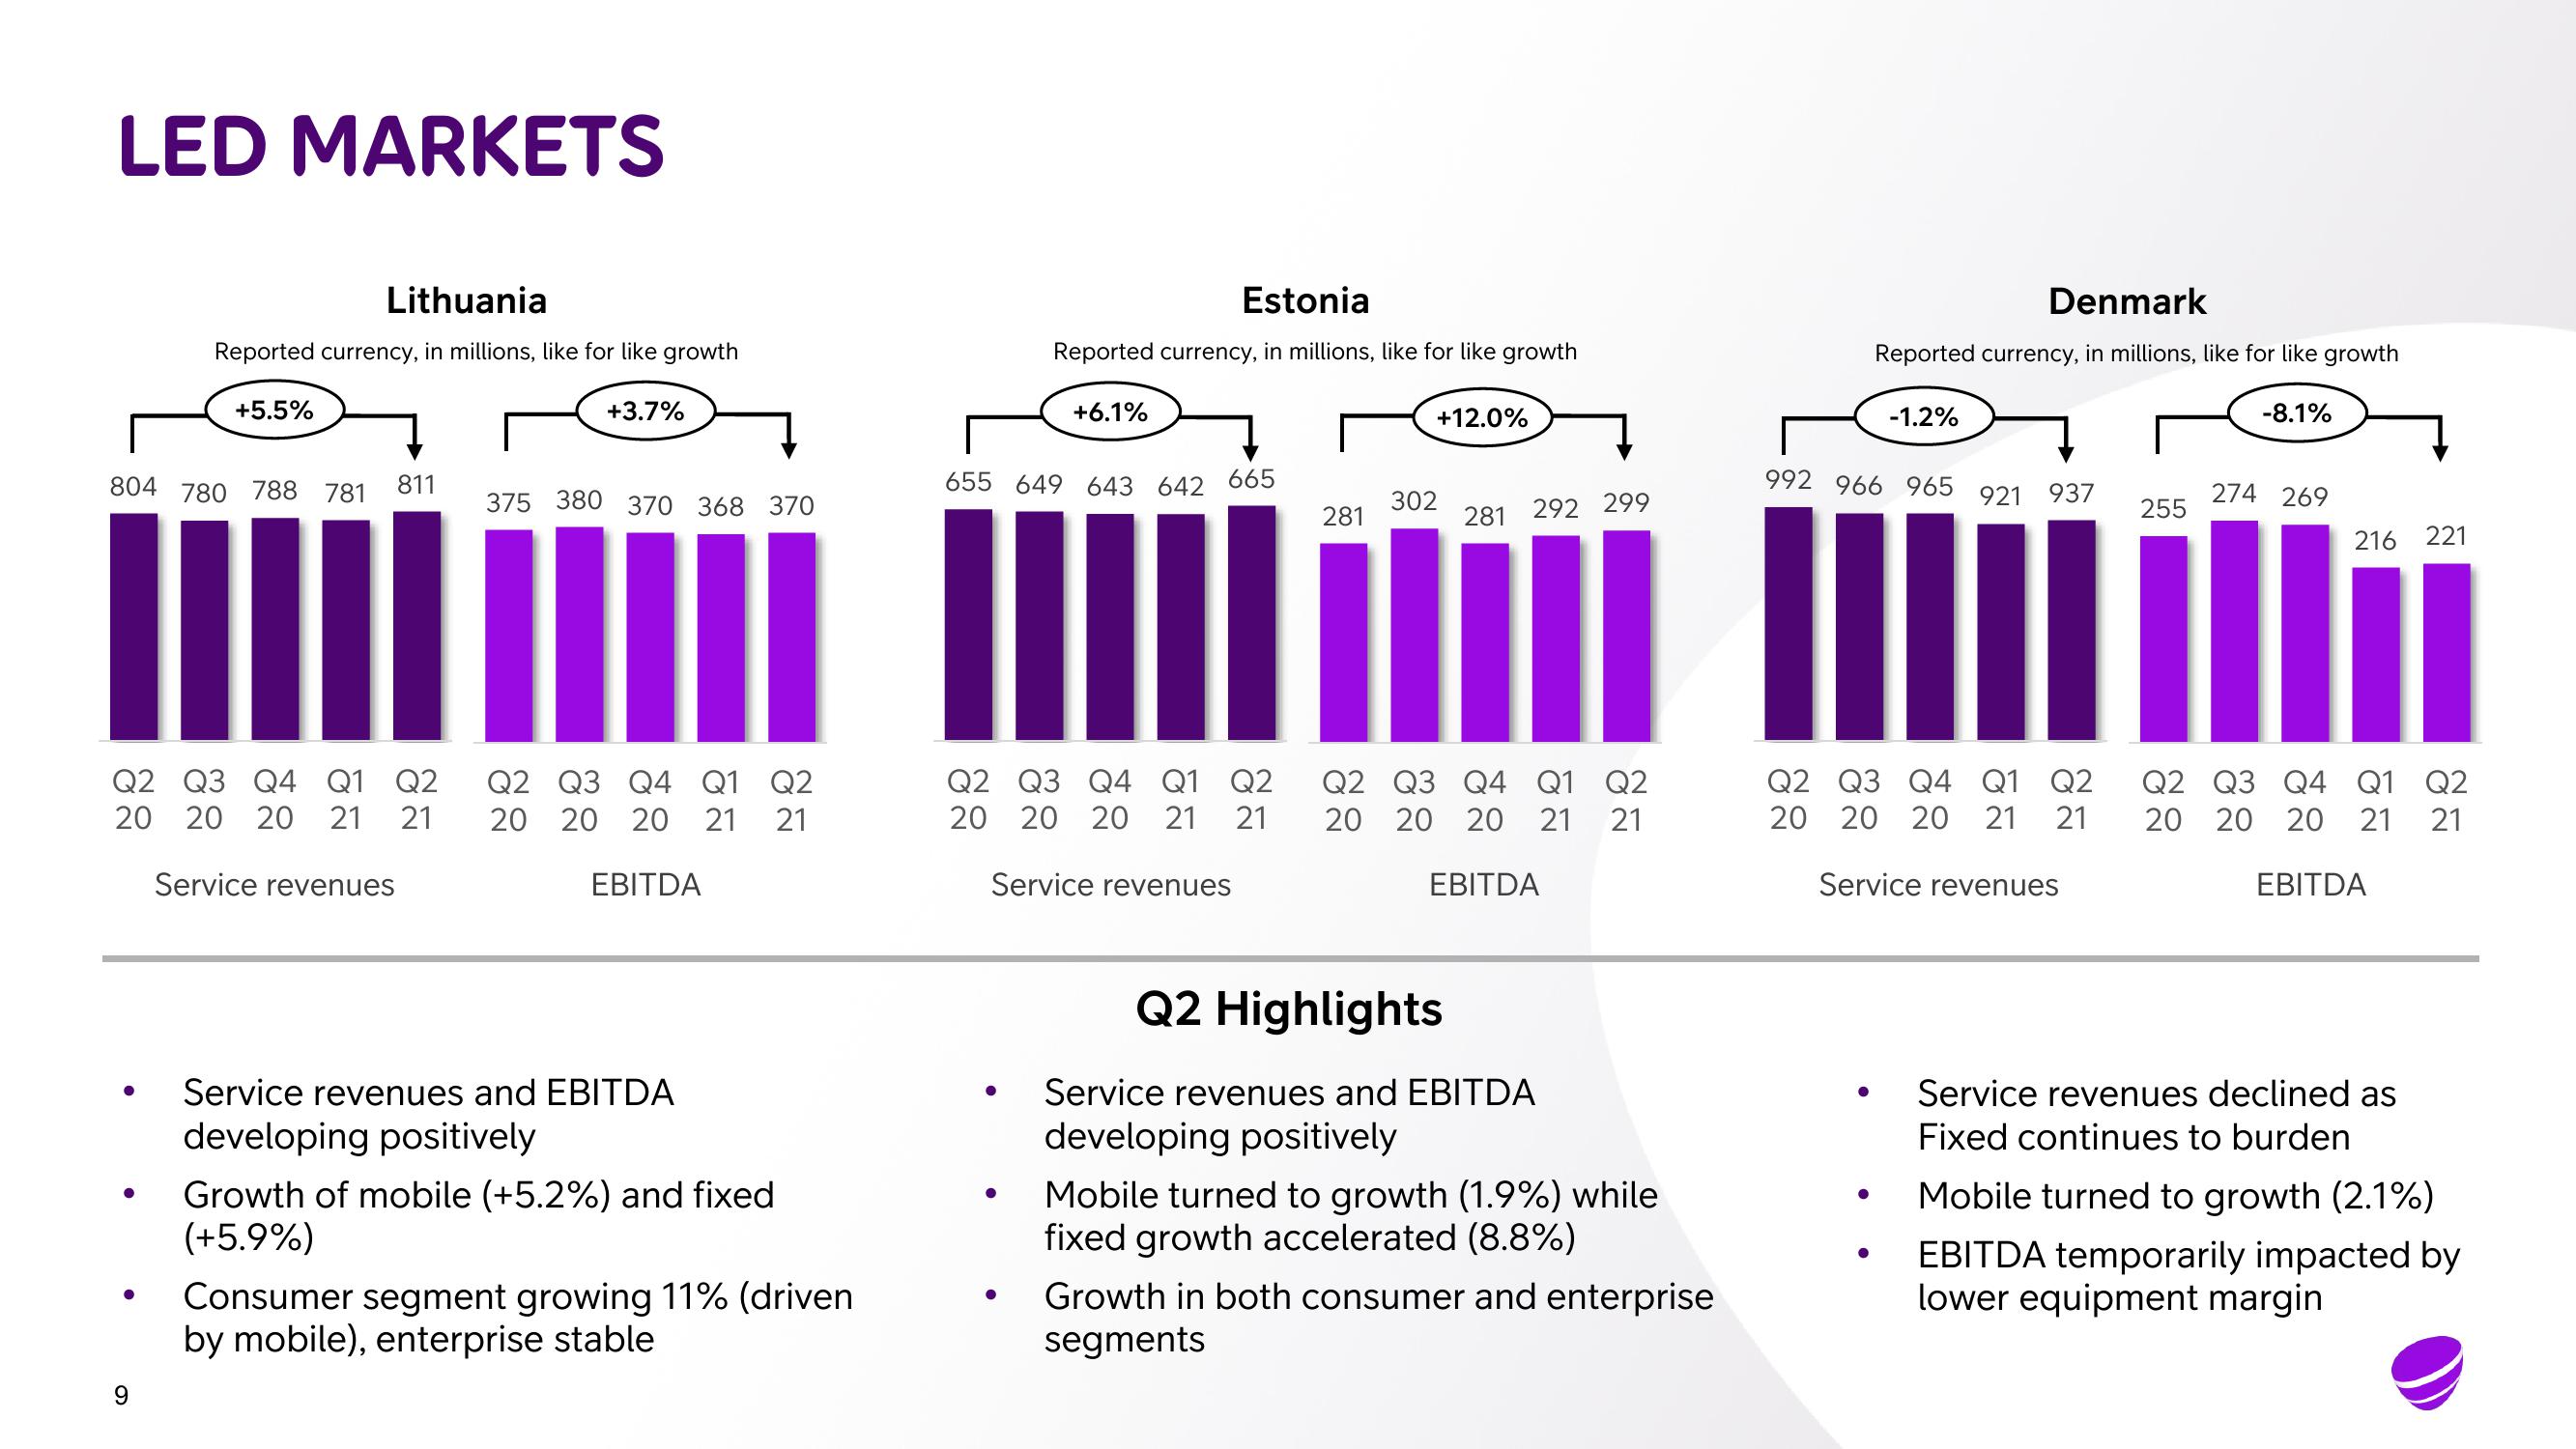
804 780 788 781 811
●
Q2 Q3 Q4 Q1 Q2
20 20 20 21 21
Service revenues
+3.7%
375 380 370 368 370
Q2 Q3 Q4 Q1 Q2
20 20 20 21 21
EBITDA
Service revenues and EBITDA
developing positively
Growth of mobile (+5.2%) and fixed
(+5.9%)
Consumer segment growing 11% (driven
by mobile), enterprise stable
Estonia
Reported currency, in millions, like for like growth
+6.1%
655 649 643 642 665
Q2 Q3 Q4 Q1 Q2
20 20 20 21 21
Service revenues
281
+12.0%
302
281 292 299
Q2 Q3 Q4 Q1 Q2
20 20 20 21 21
EBITDA
Q2 Highlights
Service revenues and EBITDA
developing positively
Mobile turned to growth (1.9%) while
fixed growth accelerated (8.8%)
Growth in both consumer and enterprise
segments
Denmark
Reported currency, in millions, like for like growth
992 966 965
●
-1.2%
●
Q2 Q3 Q4 Q1 Q2
20 20 20 21 21
Service revenues
921 937
255
-8.1%
274 269
216 221
Q2 Q3 Q4 Q1 Q2
20 20 20 21 21
EBITDA
Service revenues declined as
Fixed continues to burden
Mobile turned to growth (2.1%)
EBITDA temporarily impacted by
lower equipment marginView entire presentation