Maersk Results Presentation Deck
A.P. Moller Maersk Group
- Interim Report 02 2015
MAERSK LINE
Contents
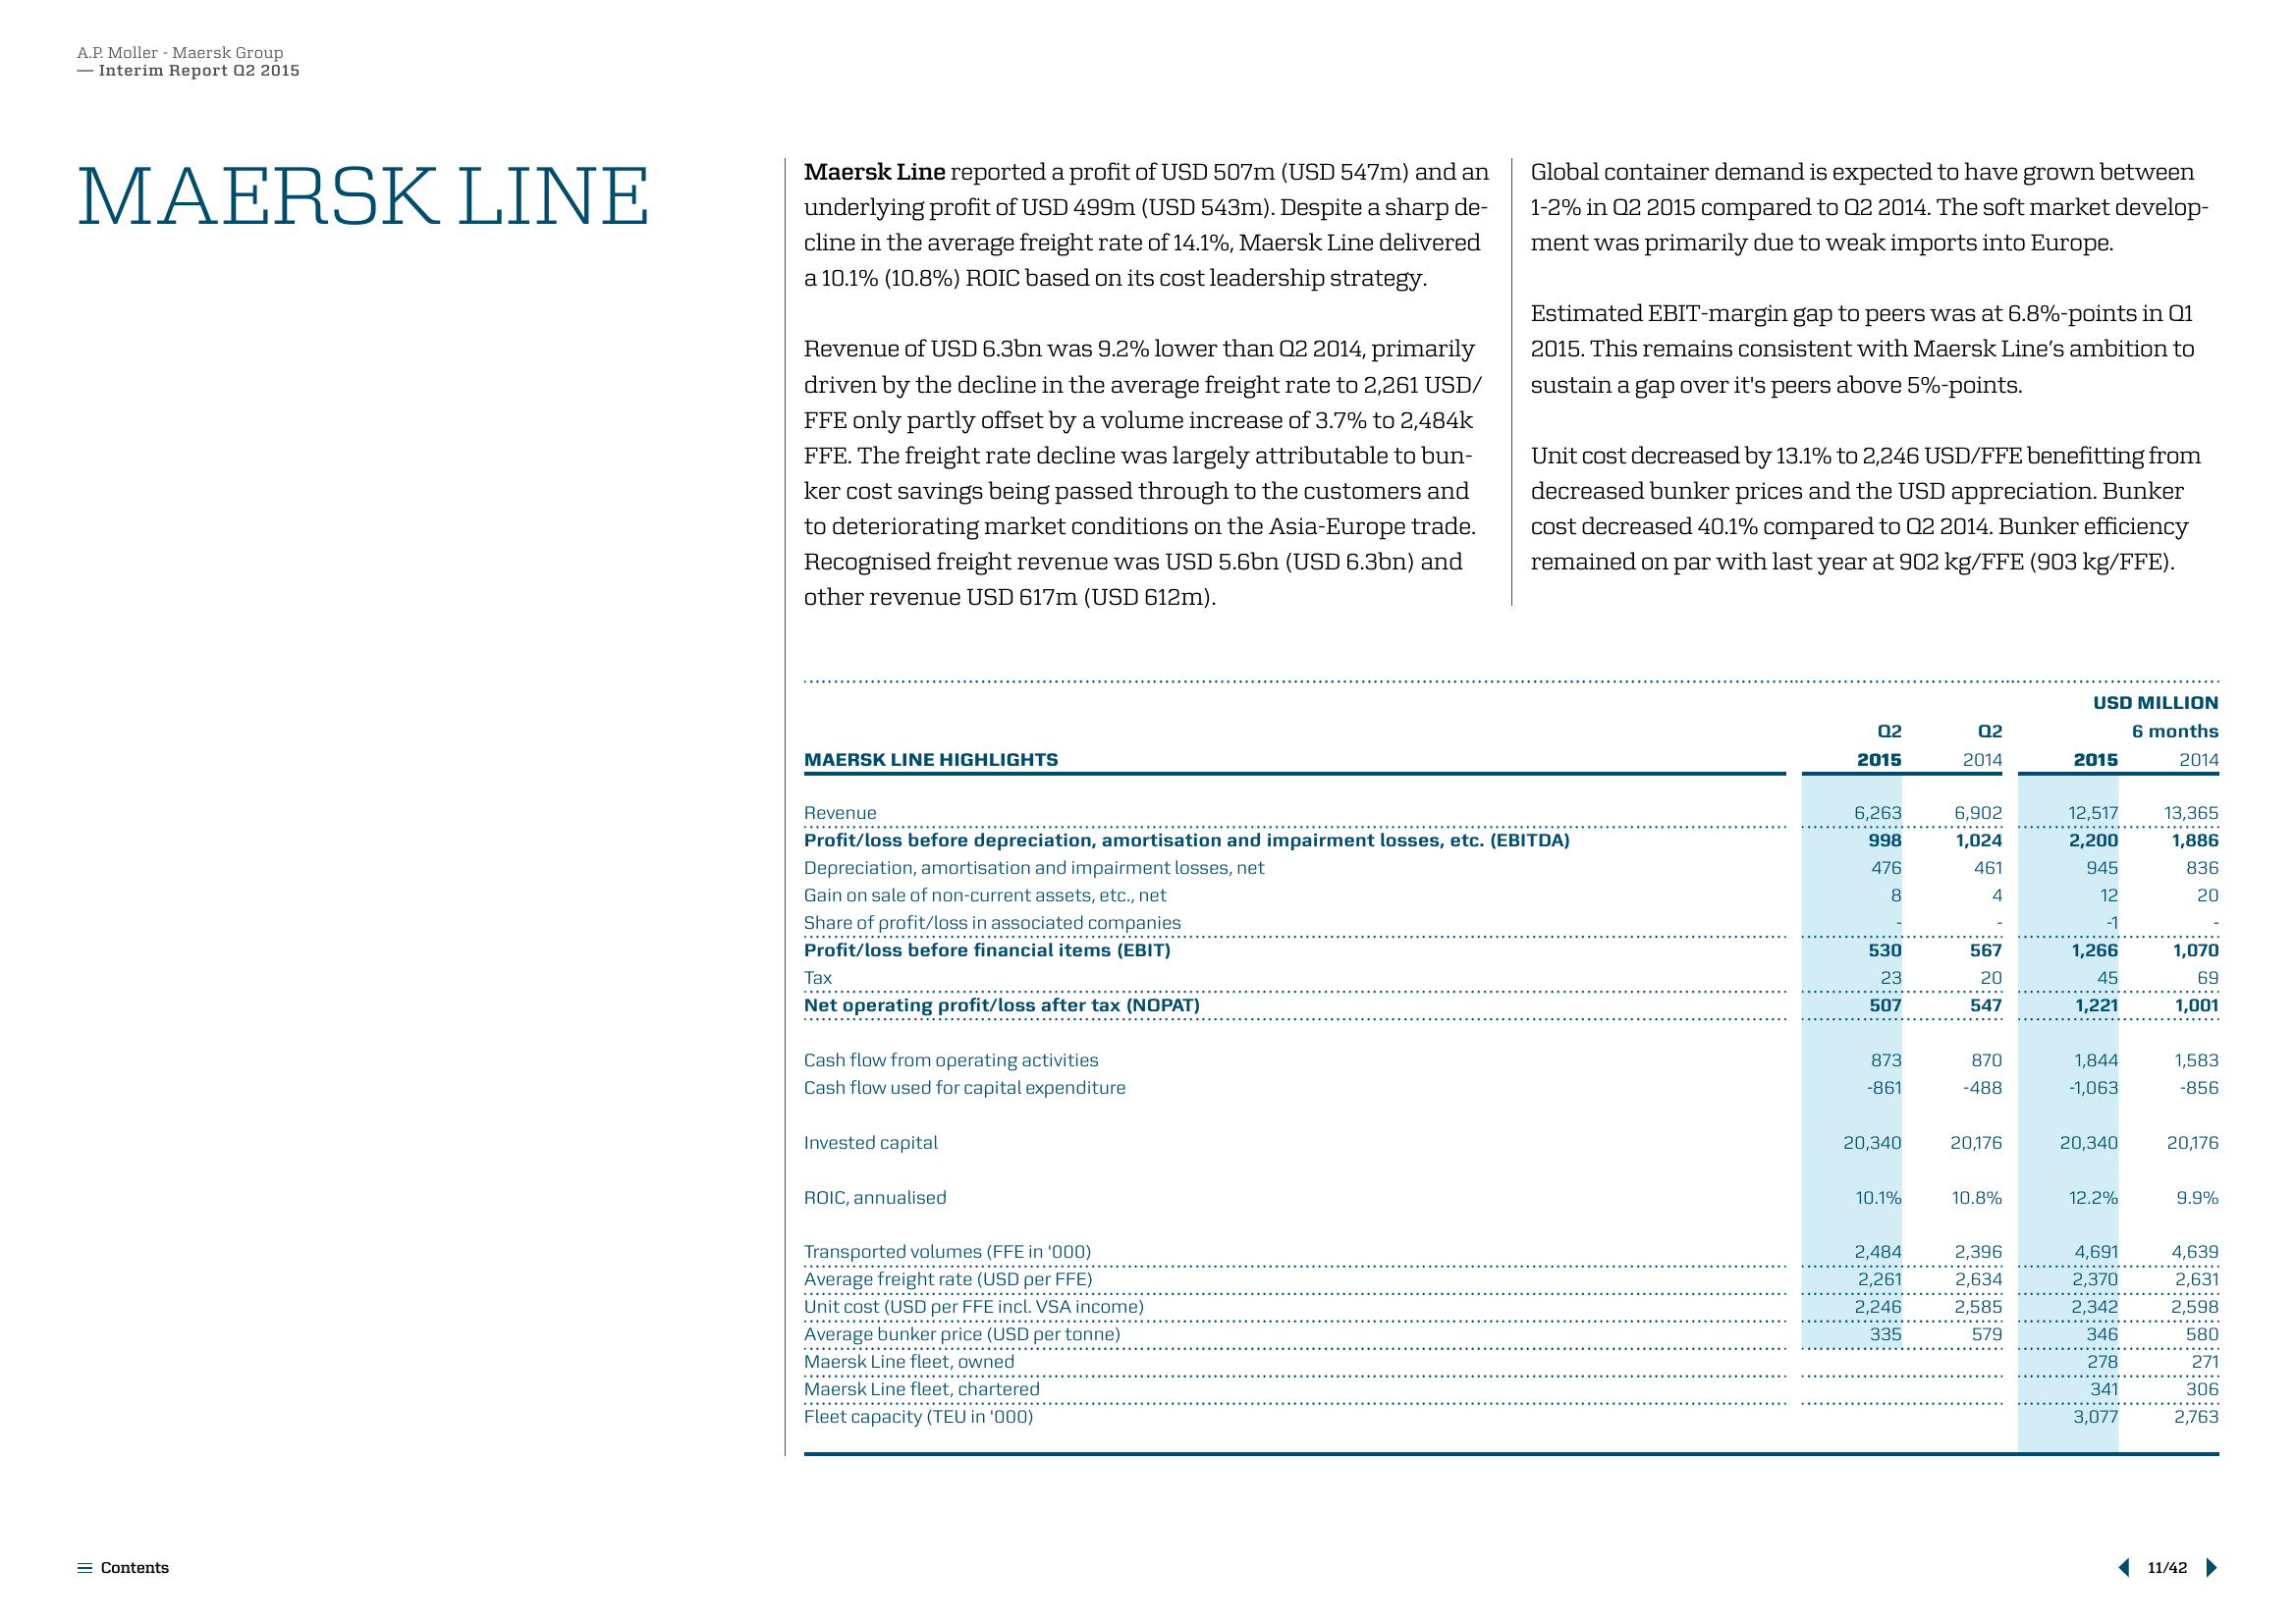
Maersk Line reported a profit of USD 507m (USD 547m) and an
underlying profit of USD 499m (USD 543m). Despite a sharp de-
cline in the average freight rate of 14.1%, Maersk Line delivered
a 10.1% (10.8%) ROIC based on its cost leadership strategy.
Revenue of USD 6.3bn was 9.2% lower than 02 2014, primarily
driven by the decline in the average freight rate to 2,261 USD/
FFE only partly offset by a volume increase of 3.7% to 2,484k
FFE. The freight rate decline was largely attributable to bun-
ker cost savings being passed through to the customers and
to deteriorating market conditions on the Asia-Europe trade.
Recognised freight revenue was USD 5.6bn (USD 6.3bn) and
other revenue USD 617m (USD 612m).
MAERSK LINE HIGHLIGHTS
Tax
Net operating profit/loss after tax (NOPAT)
Cash flow from operating activities
Cash flow used for capital expenditure
Revenue
Profit/loss before depreciation, amortisation and impairment losses, etc. (EBITDA)
Depreciation, amortisation and impairment losses, net
Gain on sale of non-current assets, etc., net
Share of profit/loss in associated companies
Profit/loss before financial items (EBIT)
Invested capital
ROIC, annualised.
Global container demand is expected to have grown between
1-2% in 02 2015 compared to Q2 2014. The soft market develop-
ment was primarily due to weak imports into Europe.
Transported volumes (FFE in '000)
Average freight rate (USD per FFE)
Unit cost (USD per FFE incl. VSA income)
********.
Average bunker price (USD per tonne)
Maersk Line fleet, owned
Maersk Line fleet, chartered
Fleet capacity (TEU in '000)
Estimated EBIT-margin gap to peers was at 6.8%-points in 01
2015. This remains consistent with Maersk Line's ambition to
sustain a gap over it's peers above 5%-points.
Unit cost decreased by 13.1% to 2,246 USD/FFE benefitting from
decreased bunker prices and the USD appreciation. Bunker
cost decreased 40.1% compared to 02 2014. Bunker efficiency
remained on par with last year at 902 kg/FFE (903 kg/FFE).
02
2015
6,263
998
476
8
530
23
507
873
-861
20,340
10.1%
2,484
2,261
2,246
335
02
2014
6,902
1,024
461
4
567
20
547
870
-488
20,176
10.8%
2,396
2,634
2,585
579
USD MILLION
6 months
2014
2015
12,517
2,200
945
12
-1
1,266
45
1,221
1,844
-1,063
20,340
12.2%
4,691
2,370
2,342
346
278
341
3,077
13,365
1,886
836
20
1,070
69
1,001
1,583
-856
20,176
9.9%
4,639
2,631
2,598
580
271
306
2,763
11/42View entire presentation