Overstock Results Presentation Deck
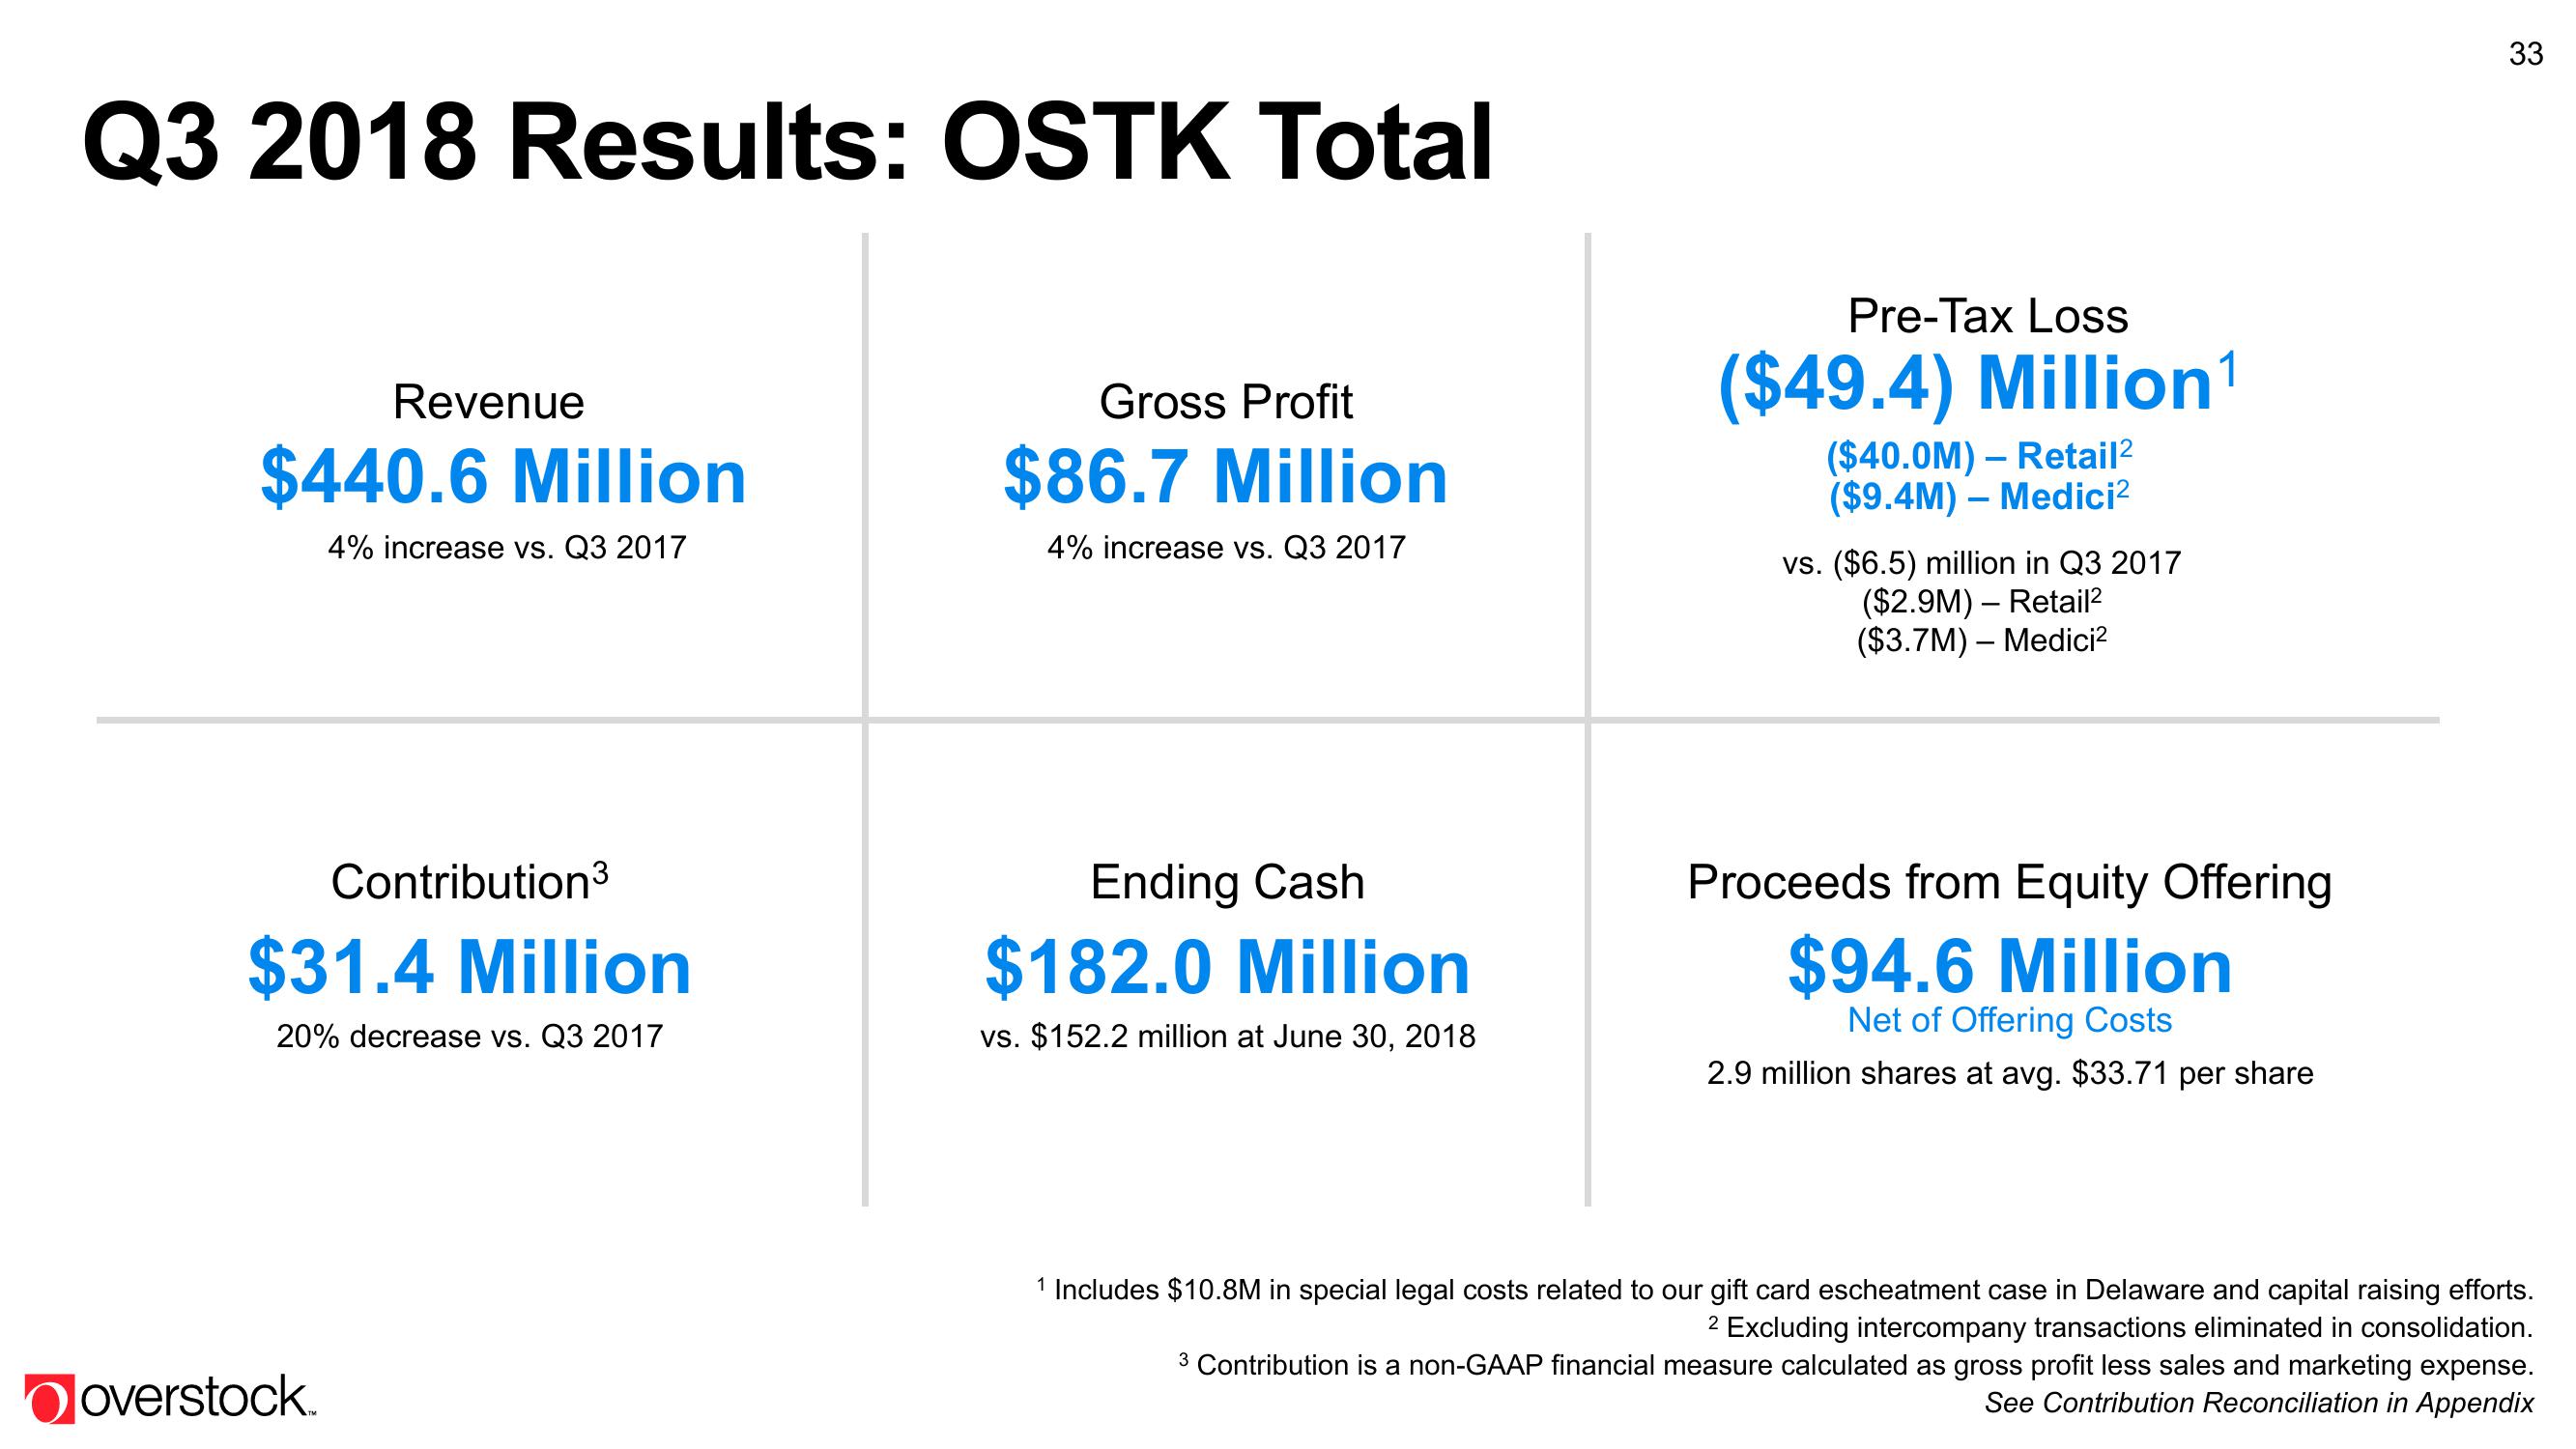
Q3 2018 Results: OSTK Total
Revenue
$440.6 Million
4% increase vs. Q3 2017
overstock.
Contribution³
$31.4 Million
20% decrease vs. Q3 2017
Gross Profit
$86.7 Million
4% increase vs. Q3 2017
Ending Cash
$182.0 Million
vs. $152.2 million at June 30, 2018
Pre-Tax Loss
($49.4) Million¹
($40.0M) - Retail²
($9.4M) - Medici²
vs. ($6.5) million in Q3 2017
($2.9M) - Retail²
($3.7M) - Medici²
Proceeds from Equity Offering
$94.6 Million
Net of Offering Costs
2.9 million shares at avg. $33.71 per share
33
1 Includes $10.8M in special legal costs related to our gift card escheatment case in Delaware and capital raising efforts.
2 Excluding intercompany transactions eliminated in consolidation.
3 Contribution is a non-GAAP financial measure calculated as gross profit less sales and marketing expense.
See Contribution Reconciliation in AppendixView entire presentation