Kin SPAC Presentation Deck
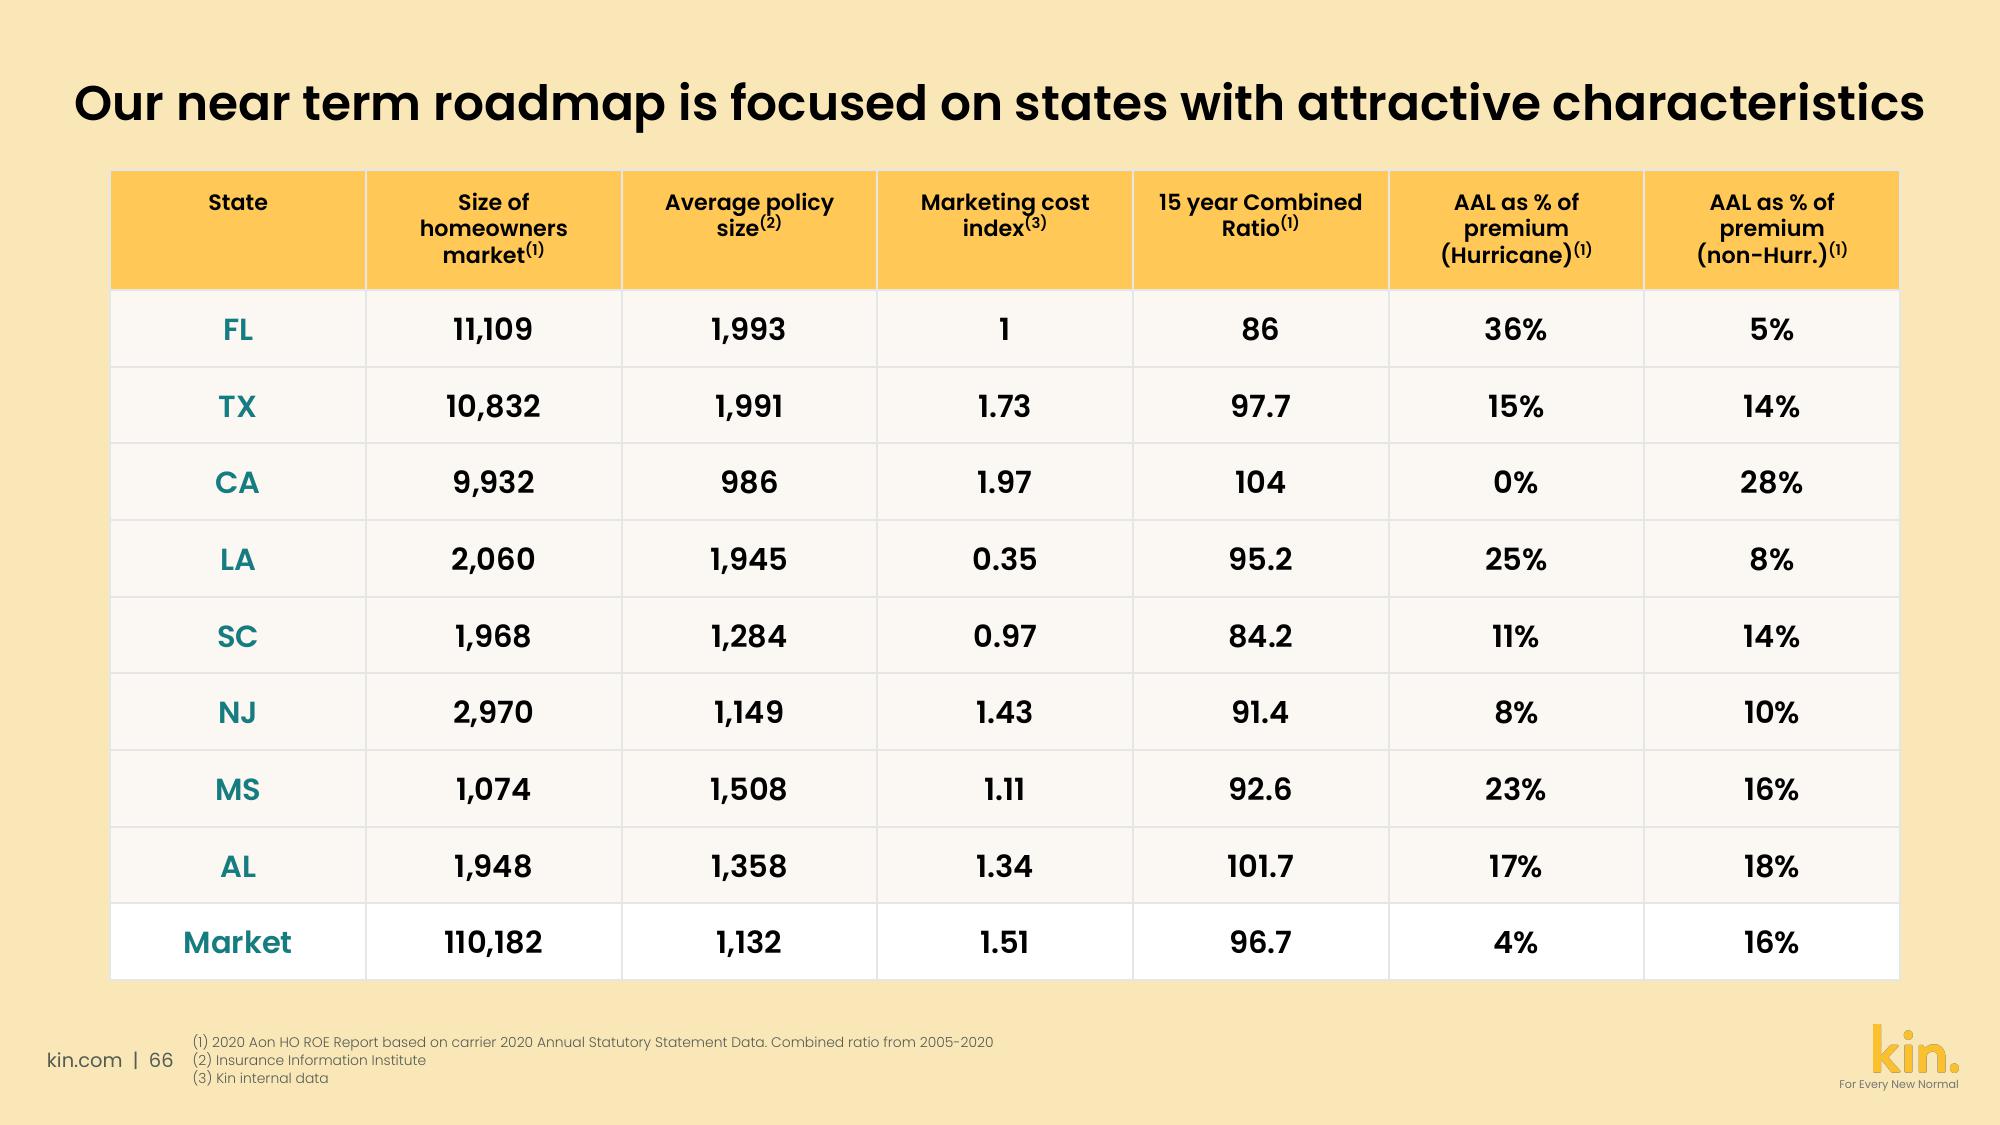
Our near term roadmap is focused on states with attractive characteristics
Size of
homeowners
market (1)
Average policy
size (2)
Marketing cost
index (3)
15 year Combined
Ratio (¹)
AAL as % of
premium
(non-Hurr.) (¹)
State
FL
TX
CA
LA
SC
NJ
MS
AL
Market
11,109
10,832
9,932
2,060
1,968
2,970
1,074
1,948
110,182
1,993
1,991
986
1,945
1,284
1,149
1,508
1,358
1,132
1.73
1.97
0.35
0.97
1.43
1.11
1.34
1.51
(1) 2020 Aon HO ROE Report based on carrier 2020 Annual Statutory Statement Data. Combined ratio from 2005-2020
kin.com | 66 (2) Insurance Information Institute
(3) Kin internal data
86
97.7
104
95.2
84.2
91.4
92.6
101.7
96.7
AAL as % of
premium
(Hurricane) (¹)
36%
15%
0%
25%
11%
8%
23%
17%
4%
5%
14%
28%
8%
14%
10%
16%
18%
16%
kin.
For Every New NormalView entire presentation