BAT Investor Conference Presentation Deck
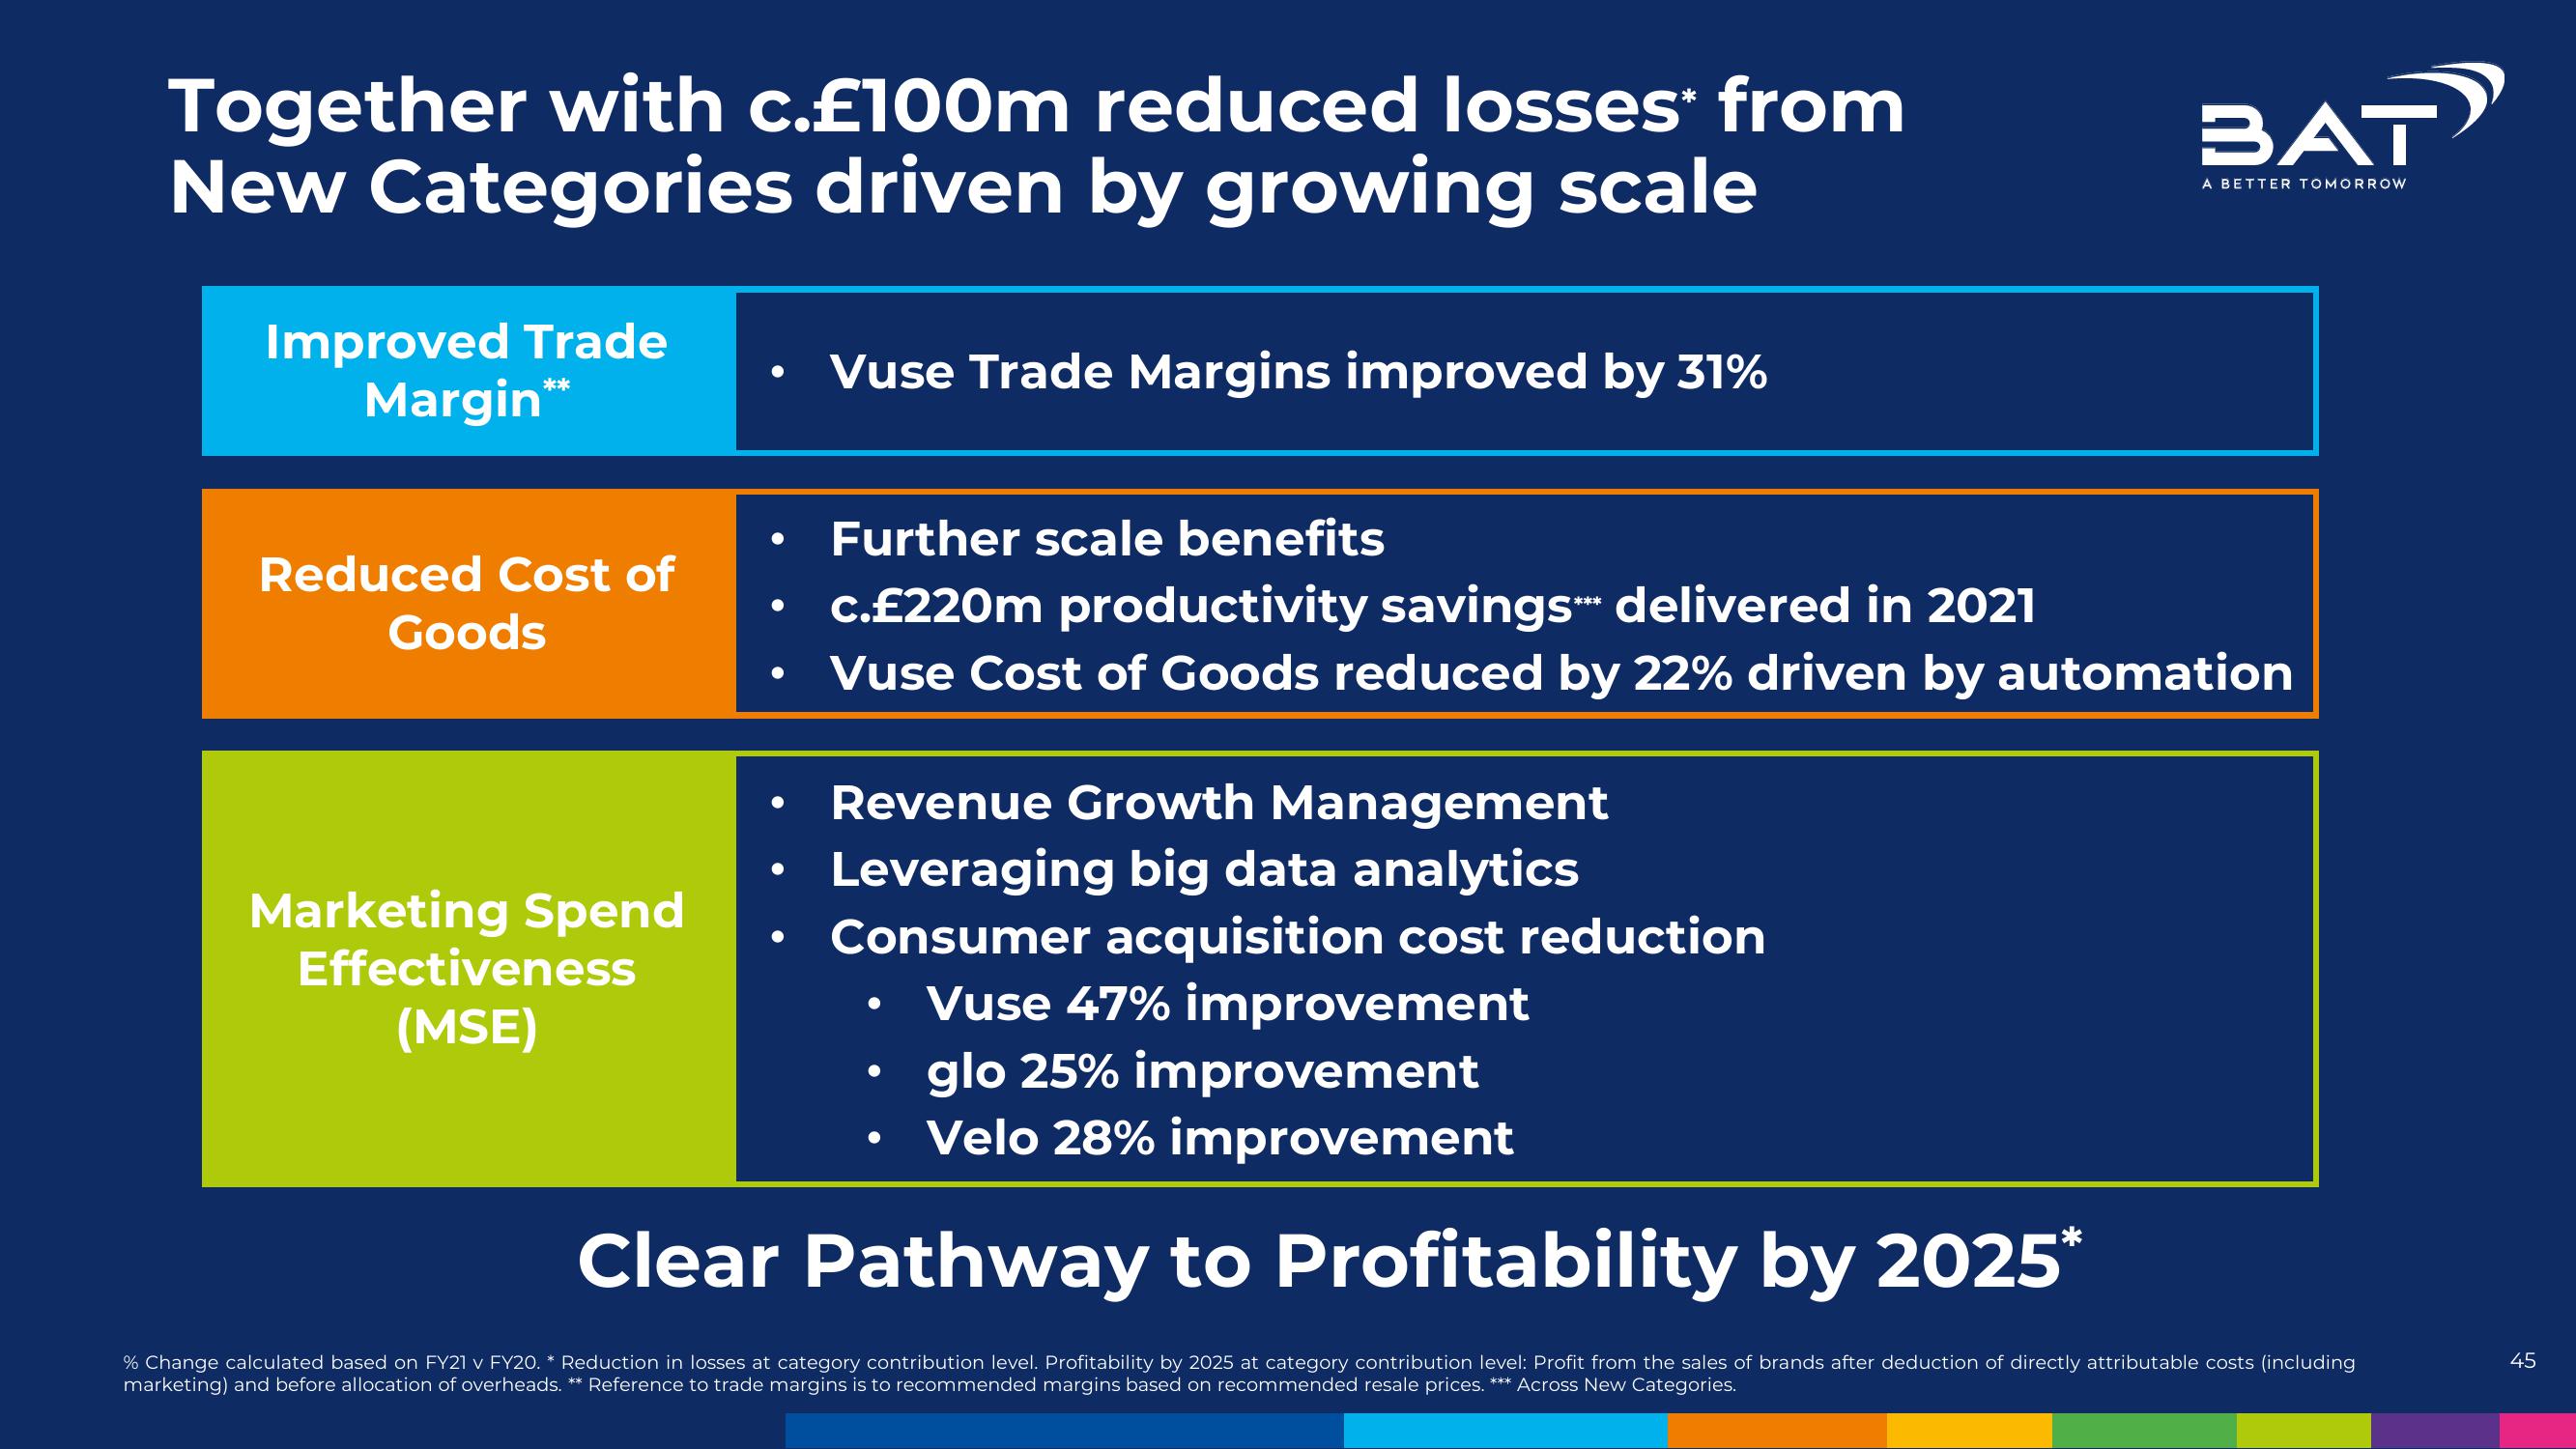
Together with c.£100m reduced losses from
New Categories driven by growing scale
Improved Trade
Margin**
Reduced Cost of
Goods
Marketing Spend
Effectiveness
(MSE)
●
●
Vuse Trade Margins improved by 31%
Revenue Growth Management
Leveraging big data analytics
Consumer acquisition cost reduction
Vuse 47% improvement
Further scale benefits
c.£220m productivity savings™ delivered in 2021
Vuse Cost of Goods reduced by 22% driven by automation
●
BAT
glo 25% improvement
Velo 28% improvement
A BETTER TOMORROW
Clear Pathway to Profitability by 2025*
% Change calculated based on FY21 v FY20. * Reduction in losses at category contribution level. Profitability by 2025 at category contribution level: Profit from the sales of brands after deduction of directly attributable costs (including
marketing) and before allocation of overheads. ** Reference to trade margins is to recommended margins based on recommended resale prices. *** Across New Categories.
45View entire presentation