Barclays Credit Presentation Deck
STRATEGY, TARGETS
& GUIDANCE
Income
£5.2bn
Q420: £4.9bn
Q421 Group highlights
Cost: income
ratio
72%
Q420: 77%
PBT
£1.5bn
Q420: £0.6bn
ROTE
9.3%
Q420: 1.8%
PERFORMANCE
TNAV per
share
292p
Sep-21:287p
Costs
£3.7bn
Q420: £3.8bn
Impairment
£(31)m
release
Q420: £0.5bn
charge
EPS
6.6p
Q420: 1.3p
CET1 ratio
15.1%
Sep-21: 15.4%
Liquidity
Coverage
Ratio
168%
Sep-21: 161%
22 | Barclays Q4 2021 Results | 23 February 2022
●
●
●
●
.
●
ASSET QUALITY
.
CAPITAL
& LEVERAGE
MREL, FUNDING
& LIQUIDITY
646
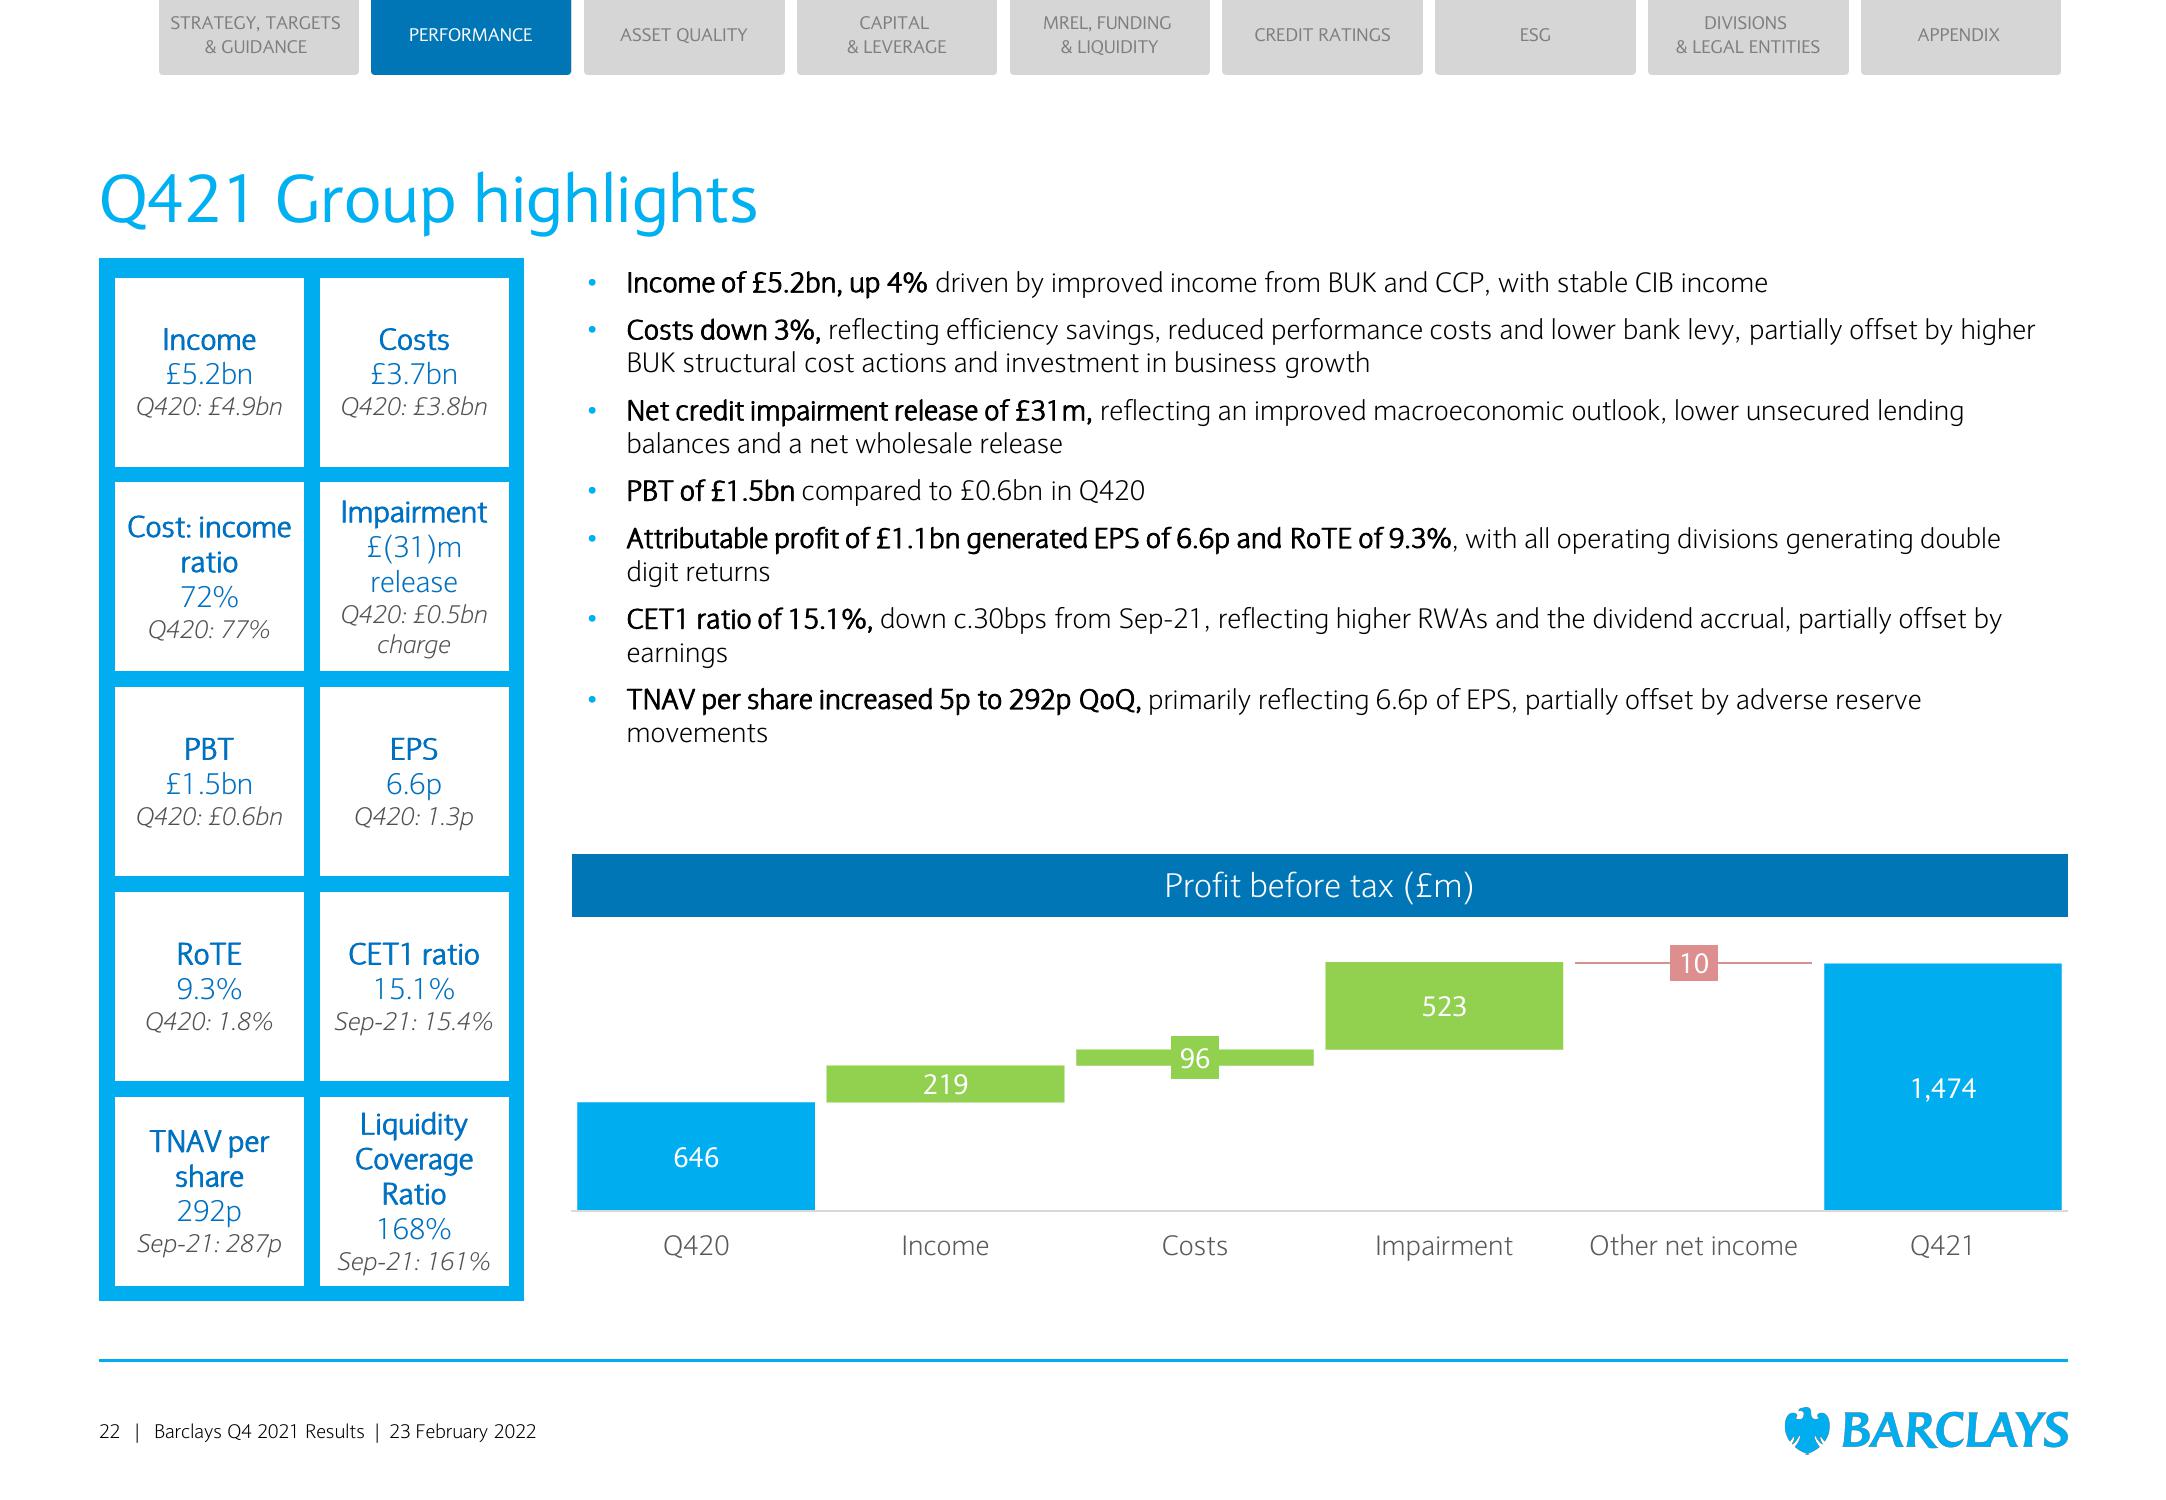
Income of £5.2bn, up 4% driven by improved income from BUK and CCP, with stable CIB income
Costs down 3%, reflecting efficiency savings, reduced performance costs and lower bank levy, partially offset by higher
BUK structural cost actions and investment in business growth
Q420
Net credit impairment release of £31 m, reflecting an improved macroeconomic outlook, lower unsecured lending
balances and a net wholesale release
CREDIT RATINGS
PBT of £1.5bn compared to £0.6bn in Q420
Attributable profit of £1.1 bn generated EPS of 6.6p and ROTE of 9.3%, with all operating divisions generating double
digit returns
219
CET1 ratio of 15.1%, down c.30bps from Sep-21, reflecting higher RWAS and the dividend accrual, partially offset by
earnings
Income
TNAV per share increased 5p to 292p QoQ, primarily reflecting 6.6p of EPS, partially offset by adverse reserve
movements
ESG
Profit before tax (£m)
96
DIVISIONS
& LEGAL ENTITIES
Costs
523
APPENDIX
Impairment
10
Other net income
1,474
Q421
BARCLAYSView entire presentation