J.P.Morgan Results Presentation Deck
Fortress balance sheet
$B, except per share data
Risk-based capital metrics¹
CET1 capital
CET1 capital ratio - Standardized
CET1 capital ratio - Advanced
Basel III Standardized RW A
Leverage-based capital metric²
Firm SLR
Liquidity metrics ³
Firm LCR
Bank LCR
Total excess HQLA
HQLA and unencumbered marketable securities
Balance sheet metrics
Total assets (EOP)
Deposits (average)
Tangible book value per share4
4Q22
$219
13.2%
13.5
$1,658
5 Reflects Net Income Applicable to Common Equity
6 Excludes AOCI on cash flow hedges and DVA related to structured notes
7 Primarily CET1 capital deductions
5.6%
112%
151
$437
1,427
$3,666
2,380
73.12
Note: Totals may not sum due to rounding
1 Estimated for the current period. See note 1 on slide 15
2 Estimated for the current period. Represents the supplementary leverage ratio ("SLR")
3Q22
$210
$214
12.5%
13.1%
13.0
13.8
$1,678 $1,639
5.3%
113%
165
$531
1,487
4Q21
$3,774
2,445
69.90
5.4%
111%
178
$629
1,652
744
2,468
71.53
Standardized CET1 ratio (%) ¹
12.5%
3Q22
63 bps
1,678
Net
income5
3Q22
(18 bps)
Common
dividend
19
13 bps
Standardized risk-weighted assets ($B)¹
Primarily
Credit Card
Loans
AOCI
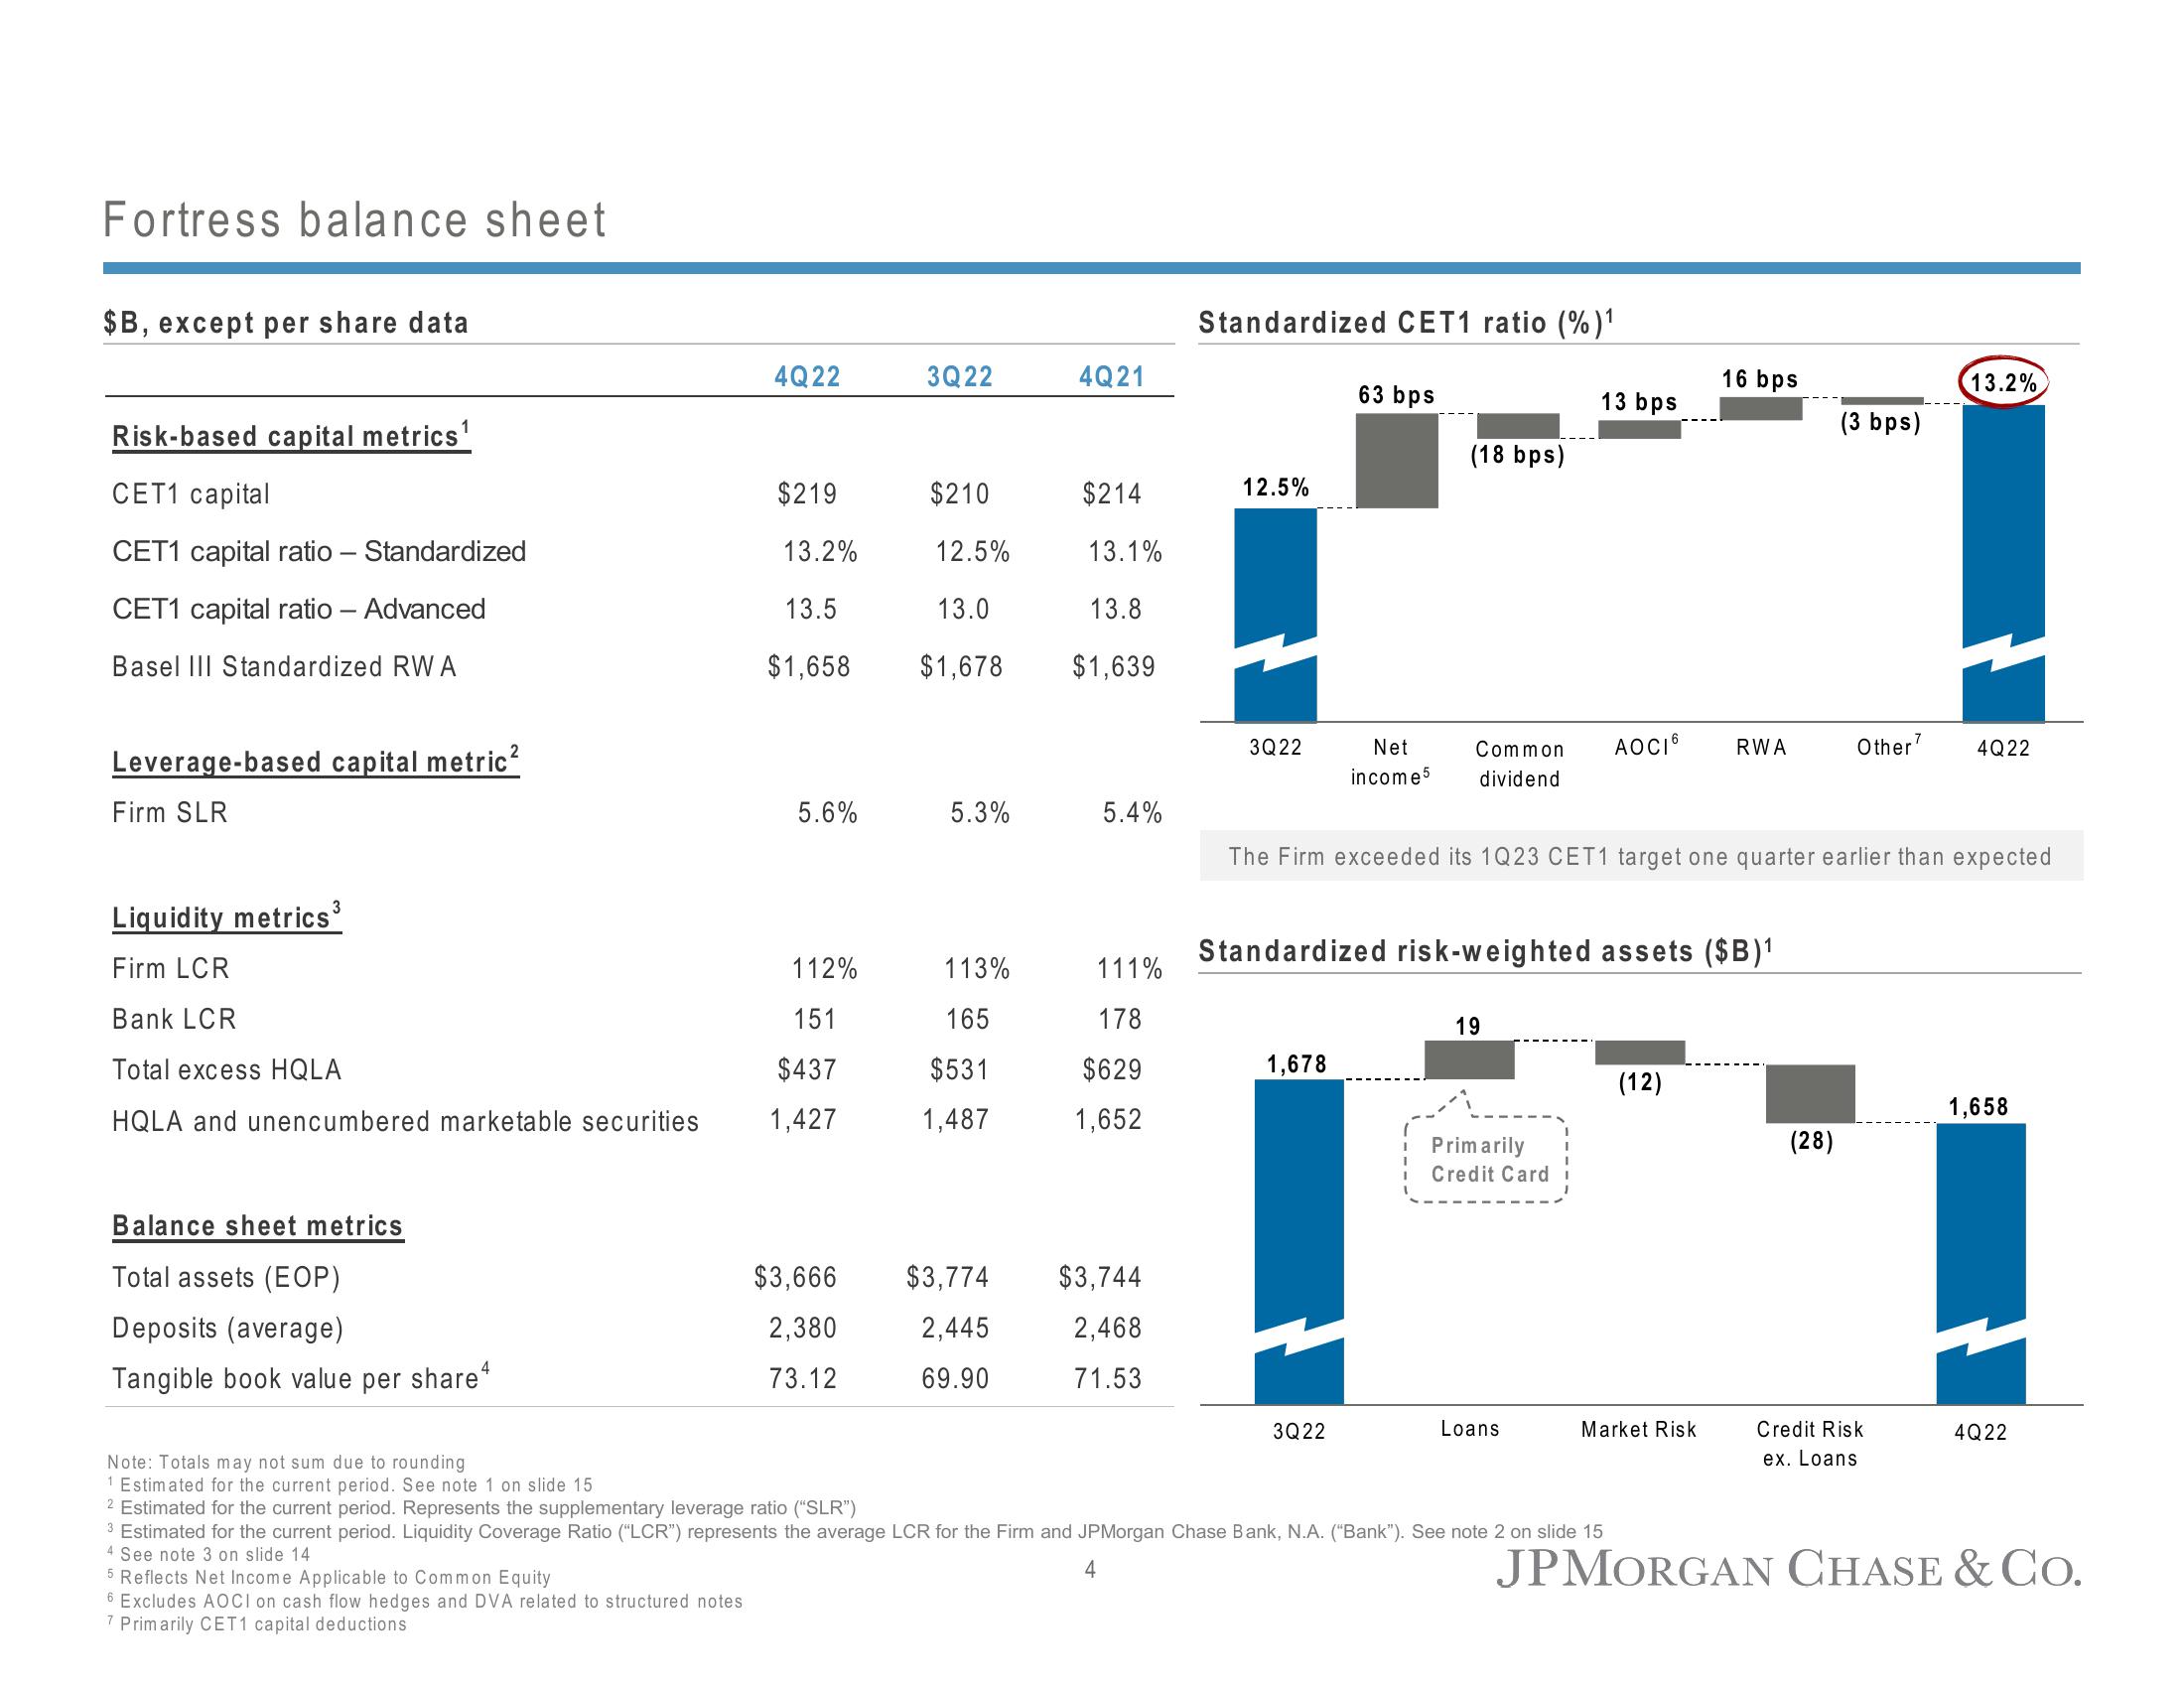
The Firm exceeded its 1Q23 CET1 target one quarter earlier than expected
3 Estimated for the current period. Liquidity Coverage Ratio ("LCR") represents the average LCR for the Firm and JPMorgan Chase Bank, N.A. ("Bank"). See note 2 on slide 15
4 See note 3 on slide 14
4
16 bps
(12)
Market Risk
RWA
(3 bps)
(28)
Other7
13.2%
Credit Risk
ex. Loans
4Q22
1,658
4Q22
JPMORGAN CHASE & Co.View entire presentation