J.P.Morgan Results Presentation Deck
Commercial Banking¹
Selected income statement data ($mm)
Revenue
Middle Market Banking
Corporate Client Banking
Commercial Real Estate Banking
Other
Expense
Credit costs
Net income²
Key drivers / statistics ($B)³
Equity
ROE²
Overhead ratio
Gross IB revenue ($mm)
Average loans4
Average client deposits
Allowance for loan losses
Nonaccrual loans 5
6
Net charge-off/(recovery) rate
ALL/loans6
1 See note 1 on slide 14
2 See note 3 on slide 15
For additional footnotes see slide 16
4Q22
$3,404
1,619
1,109
666
10
1,254
284
$1,423
4Q22
$25.0
22%
37
$700
235.3
278.9
3.3
0.8
0.06%
1.42
$ 0/(U)
3Q22
$356
253
57
42
74
(334)
$477
3Q22
$25.0
14%
39
$761
229.1
281.3
3.1
0.8
0.07%
1.32
4Q21
$792
557
181
52
2
195
373
$189
4Q21
$24.0
19%
41
$1,456
205.6
323.8
2.2
0.7
0.02%
1.08
7
CIB
CB
AWM Corp.
Financial performance
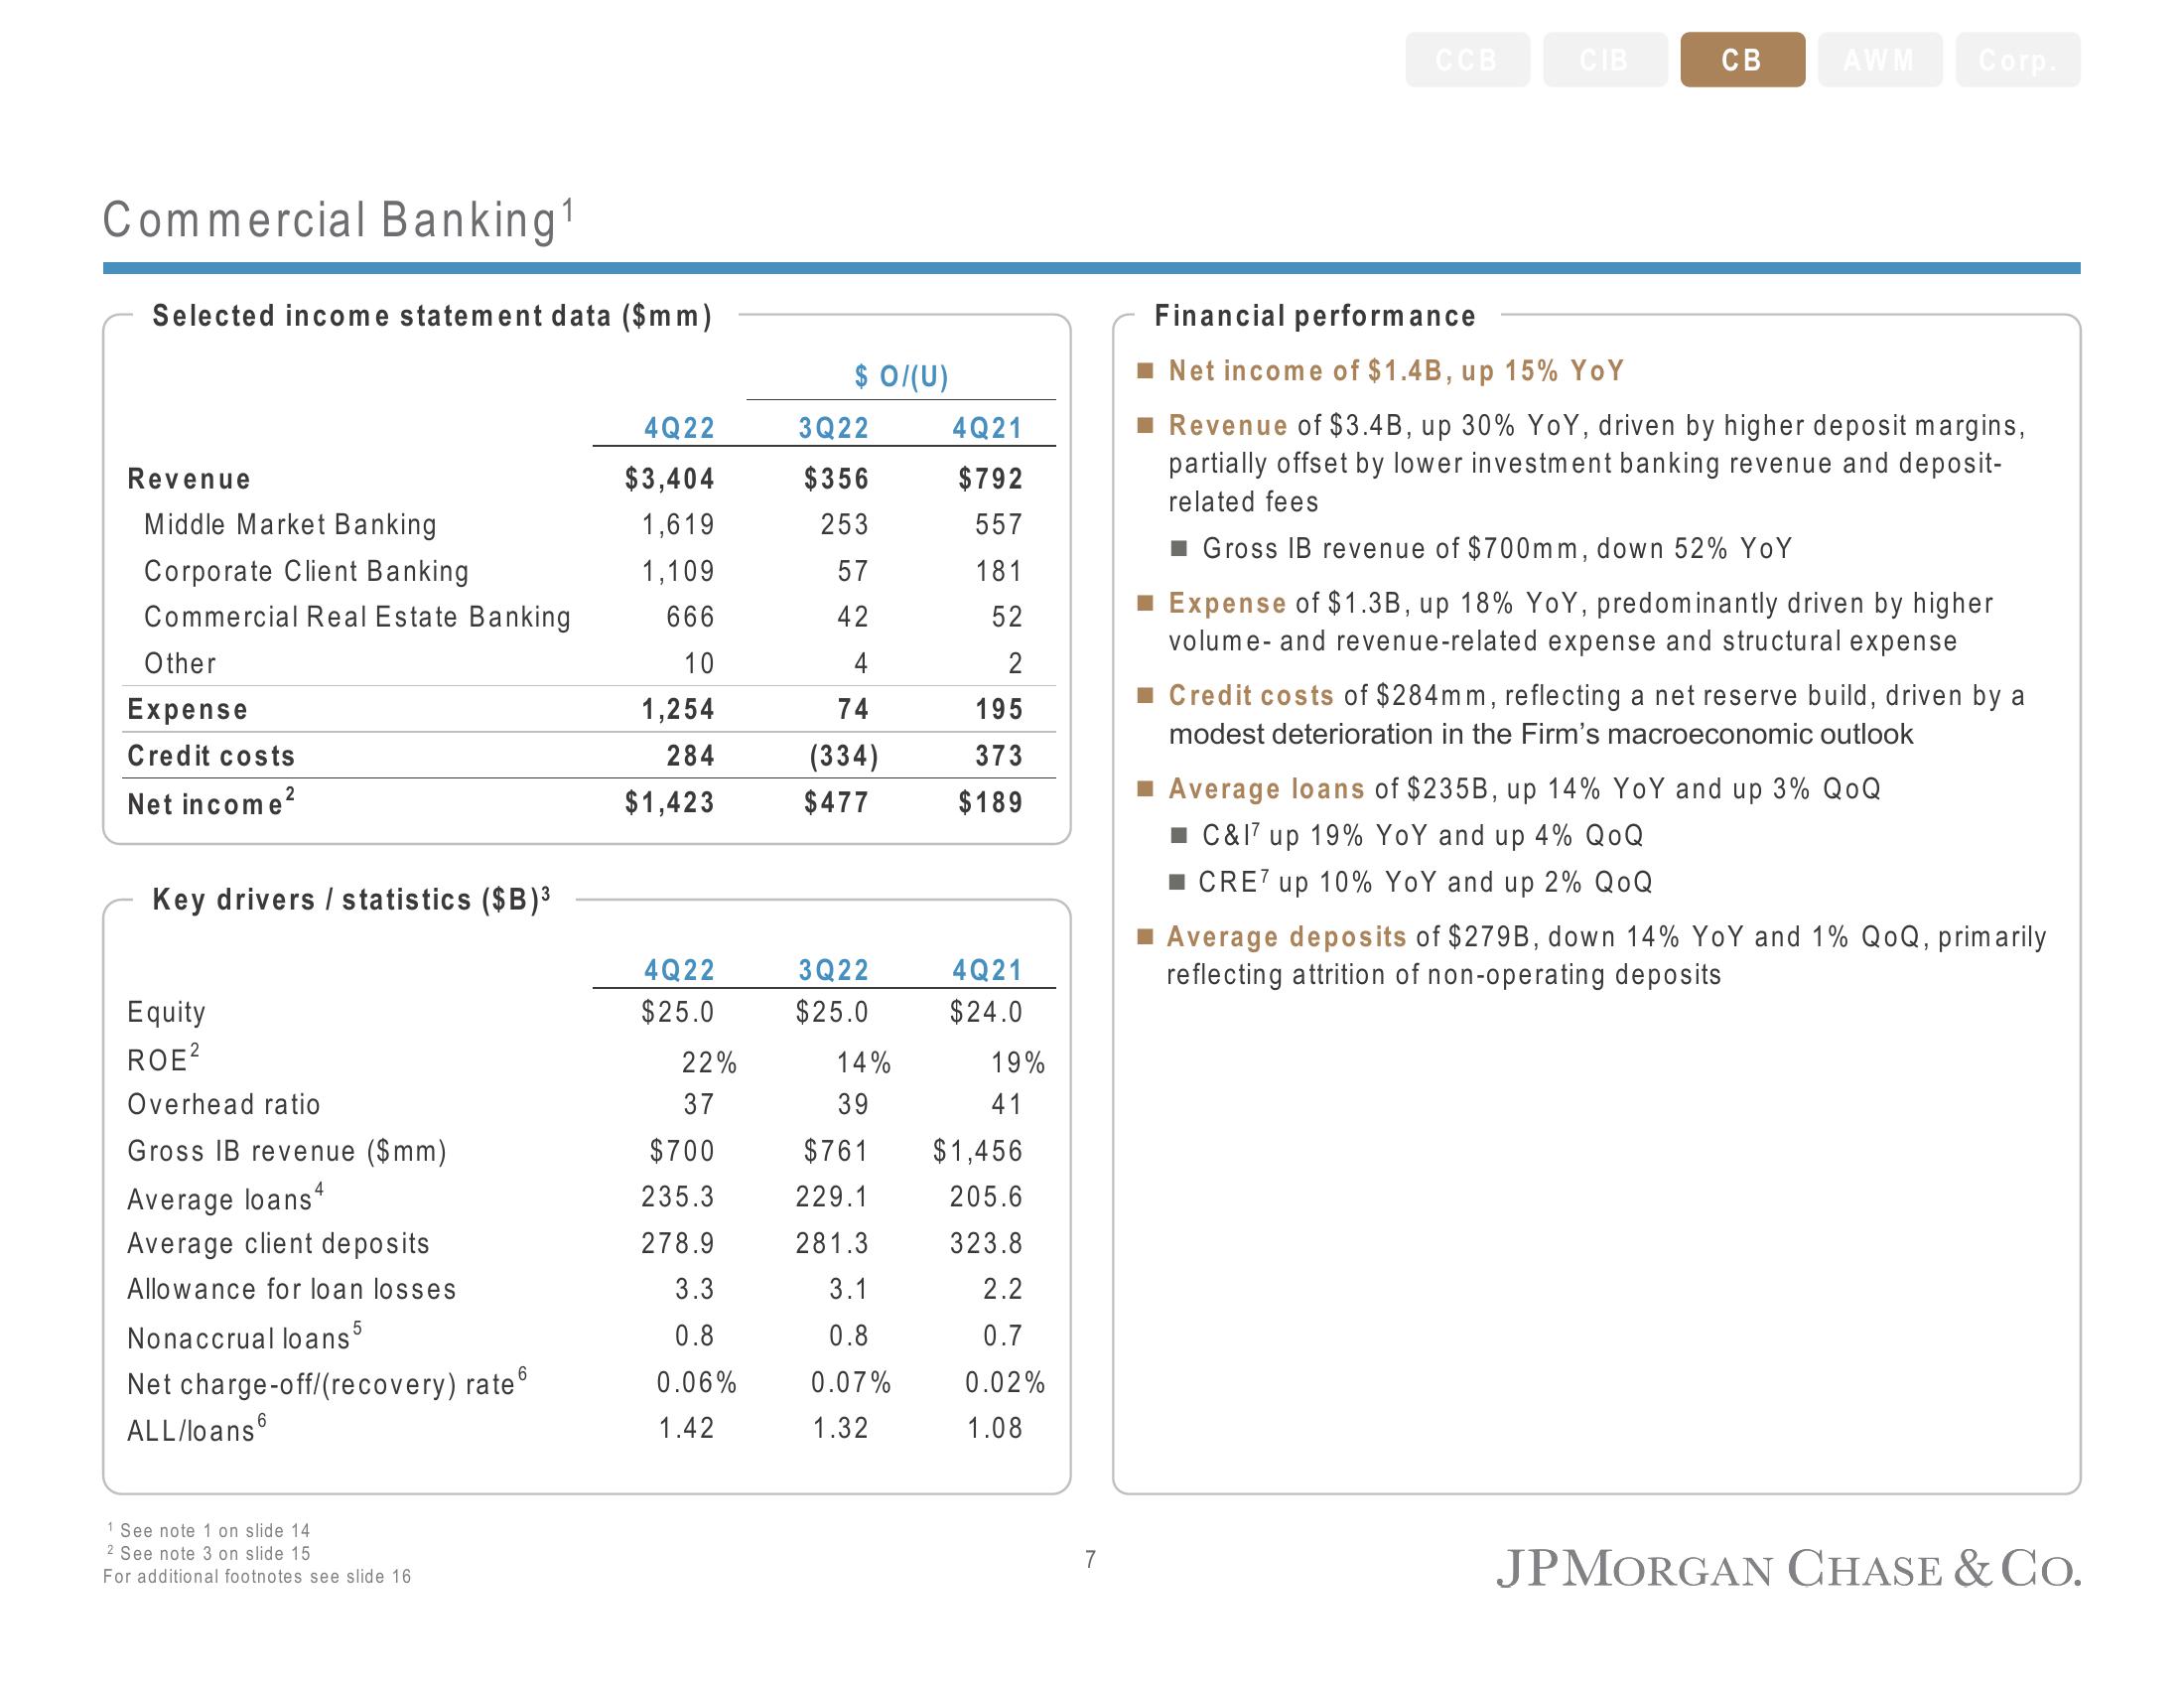
■ Net income of $1.4B, up 15% YoY
■ Revenue of $3.4B, up 30% YoY, driven by higher deposit margins,
partially offset by lower investment banking revenue and deposit-
related fees
Gross IB revenue of $700mm, down 52% YoY
■ Expense of $1.3B, up 18% YoY, predominantly driven by higher
volume- and revenue-related expense and structural expense
■ Credit costs of $284mm, reflecting a net reserve build, driven by a
modest deterioration in the Firm's macroeconomic outlook
■ Average loans of $235B, up 14% YoY and up 3% QoQ
■ C&17 up 19% YoY and up 4% QOQ
CRE7 up 10% YoY and up 2% QOQ
■ Average deposits of $279B, down 14% YoY and 1% QoQ, primarily
reflecting attrition of non-operating deposits
JPMORGAN CHASE & Co.View entire presentation