Comcast Shareholder Engagement Presentation Deck
Delivered Consistent and Strong Financial Results
Executive Compensation Program Tied to Financial Performance Metrics
5
Consolidated Revenue
($ in billions)
$94.5
2018
Adjusted EPS
$2.73
$108.9
2019
$3.13
$103.6
2020
$2.61
$116.4
2021
$3.23
Consolidated Adjusted EBITDA
($ in billions)
$30.2
2018
Free Cash Flow
($ in billions)
$12.6
$34.3
2019
$13.4
$30.8
2019
2020
$13.3
2018
2019
2020
2021
2018
2020
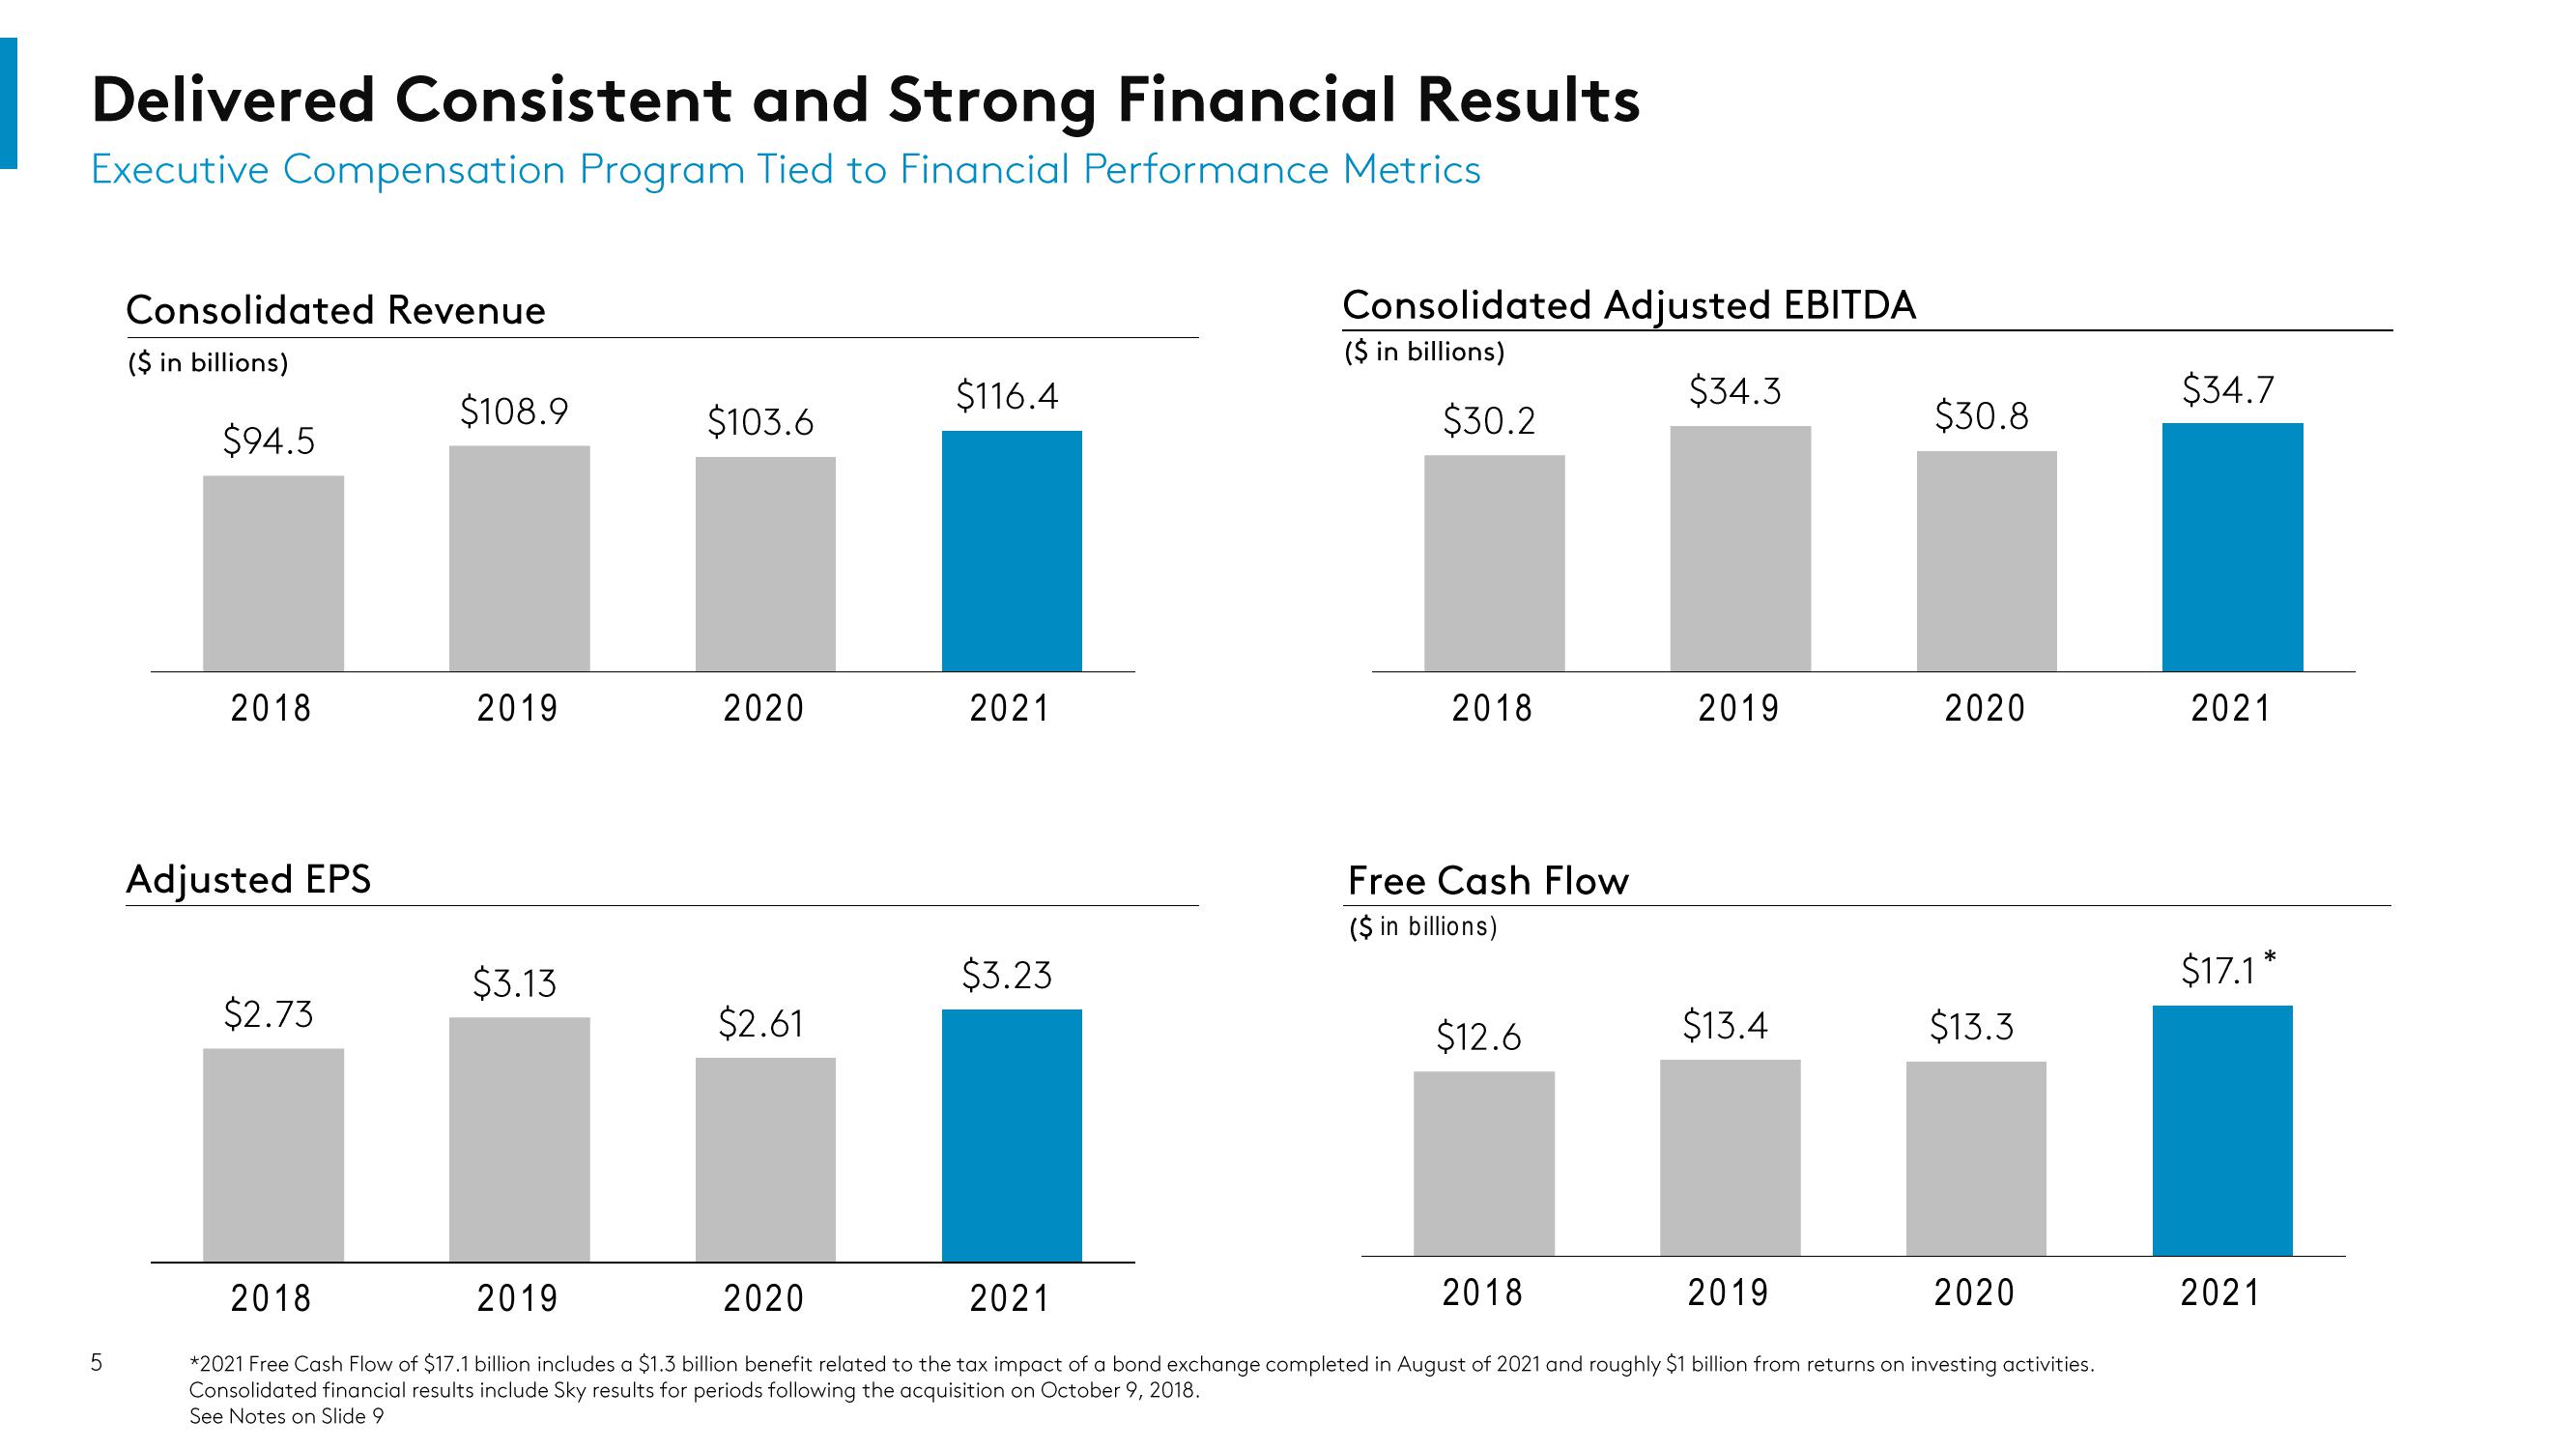
*2021 Free Cash Flow of $17.1 billion includes a $1.3 billion benefit related to the tax impact of a bond exchange completed in August of 2021 and roughly $1 billion from returns on investing activities.
Consolidated financial results include Sky results for periods following the acquisition on October 9, 2018.
See Notes on Slide 9
$34.7
2021
$17.1*
2021View entire presentation