WeWork SPAC Presentation Deck
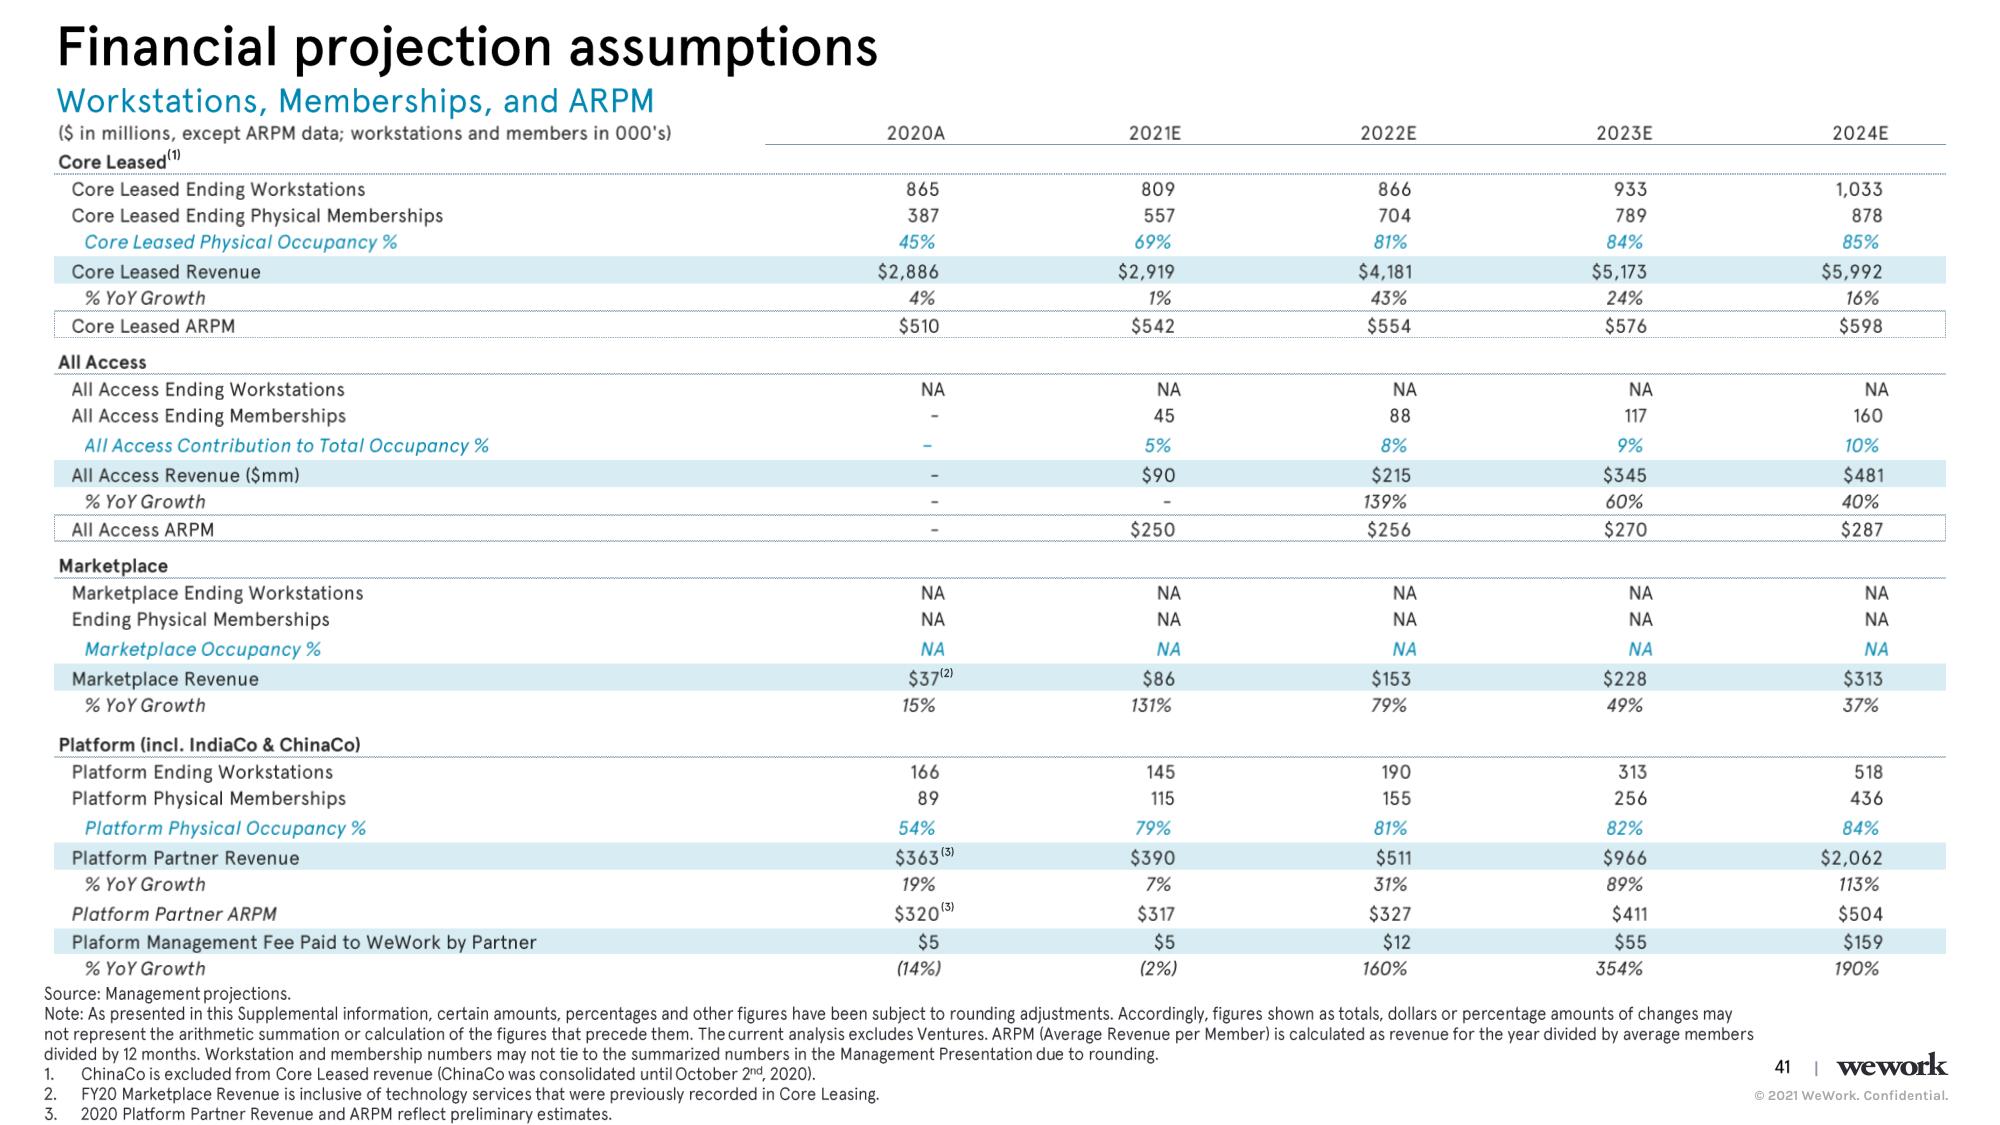
Financial projection assumptions
Workstations, Memberships, and ARPM
($ in millions, except ARPM data; workstations and members in 000's)
Core Leased (1)
Core Leased Ending Workstations
Core Leased Ending Physical Memberships
Core Leased Physical Occupancy %
Core Leased Revenue
% YoY Growth
Core Leased ARPM
All Access
All Access Ending Workstations
All Access Ending Memberships
All Access Contribution to Total Occupancy %
1.
2.
3.
All Access Revenue ($mm)
% YoY Growth
All Access ARPM
Marketplace
Marketplace Ending Workstations
Ending Physical Memberships
Marketplace Occupancy %
Marketplace Revenue
% YoY Growth
Platform (incl. IndiaCo & ChinaCo)
Platform Ending Workstations
Platform Physical Memberships
Platform Physical Occupancy %
Platform Partner Revenue
% YoY Growth
Platform Partner ARPM
Plaform Management Fee Paid to WeWork by Partner
% YoY Growth
2020A
865
387
45%
$2,886
4%
$510
FY20 Marketplace Revenue is inclusive of technology services that were previously recorded in Core Leasing.
2020 Platform Partner Revenue and ARPM reflect preliminary estimates.
ΝΑ
ΝΑ
ΝΑ
ΝΑ
$37(2)
15%
166
89
54%
$363 (3)
19%
$320 (3)
$5
(14%)
2021E
809
557
69%
$2,919
1%
$542
ΝΑ
45
5%
$90
$250
ΝΑ
ΝΑ
ΝΑ
$86
131%
145
115
79%
$390
7%
$317
$5
(2%)
2022E
866
704
81%
$4,181
43%
$554
ΝΑ
88
8%
$215
139%
$256
ΝΑ
ΝΑ
ΝΑ
$153
79%
190
155
81%
$511
31%
$327
$12
160%
2023E
933
789
84%
$5,173
24%
$576
ΝΑ
117
9%
$345
60%
$270
ΝΑ
ΝΑ
ΝΑ
$228
49%
313
256
82%
$966
89%
$411
$55
Source: Management projections.
Note: As presented in this Supplemental information, certain amounts, percentages and other figures have been subject to rounding adjustments. Accordingly, figures shown as totals, dollars or percentage amounts of changes may
not represent the arithmetic summation or calculation of the figures that precede them. The current analysis excludes Ventures. ARPM (Average Revenue per Member) is calculated as revenue for the year divided by average members
divided by 12 months. Workstation and membership numbers may not tie to the summarized numbers in the Management Presentation due to rounding.
ChinaCo is excluded from Core Leased revenue (ChinaCo was consolidated until October 2nd, 2020).
354%
2024E
1,033
878
85%
$5,992
16%
$598
ΝΑ
160
10%
$481
40%
$287
ΝΑ
ΝΑ
ΝΑ
$313
37%
518
436
84%
$2,062
113%
$504
$159
190%
41
wework
Ⓒ2021 WeWork. Confidential.View entire presentation