AMC Investor Presentation Deck
Track Record of Accretive Investments
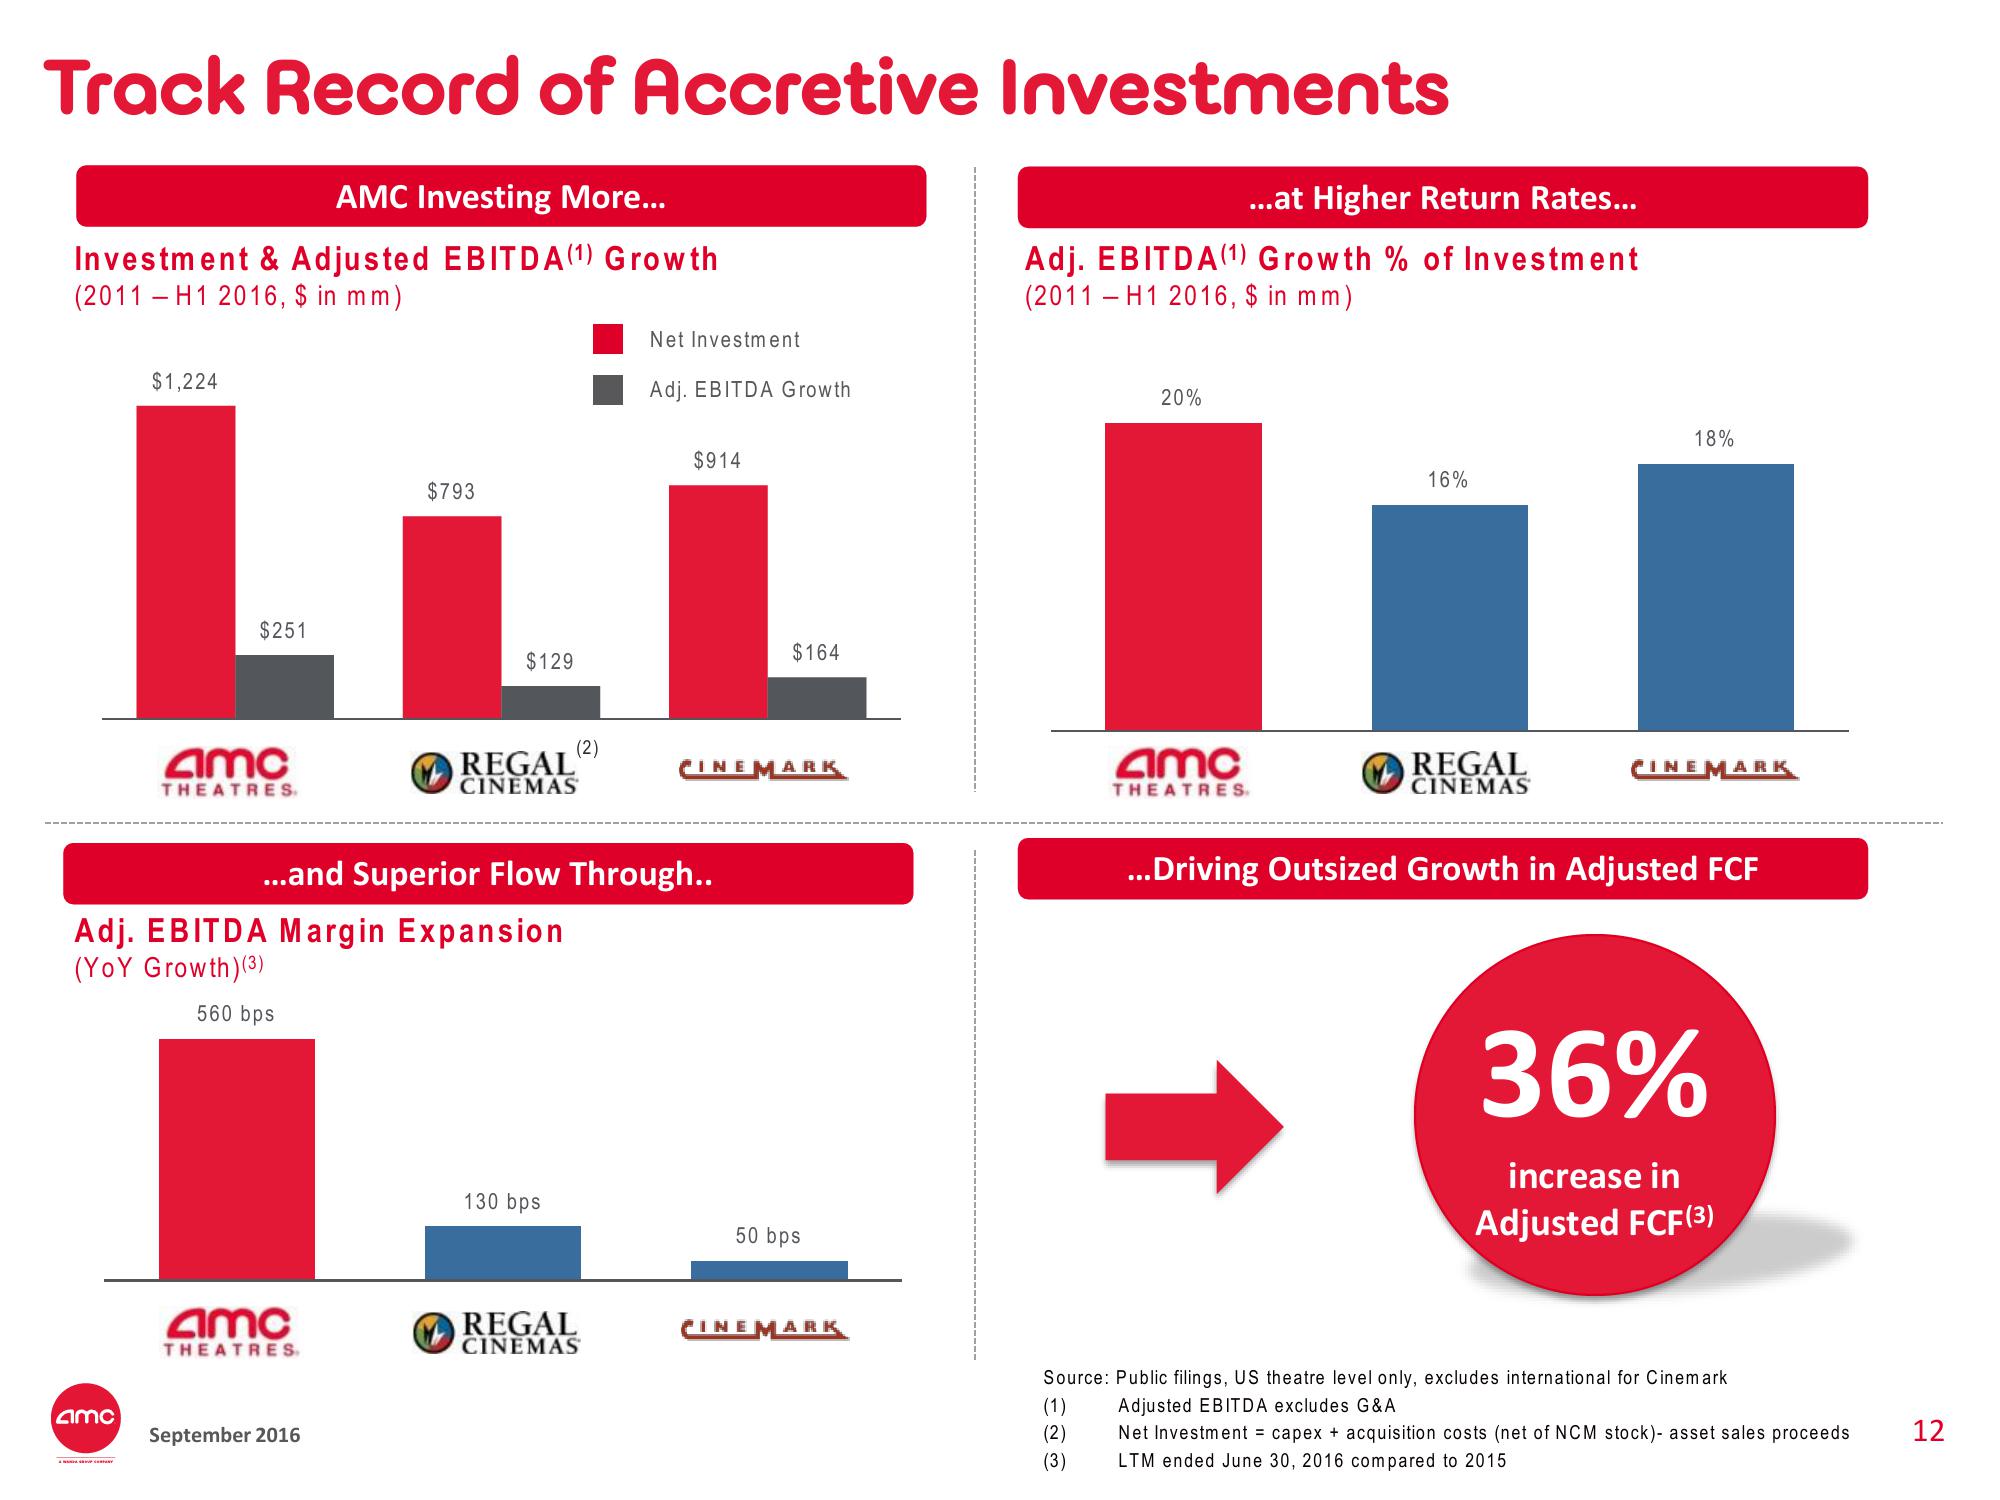
AMC Investing More...
Investment & Adjusted EBITDA (¹) Growth
(2011 - H1 2016, $ in mm)
$1,224
amc
$793
LLL
$129
(2)
$251
amc
THEATRES.
Adj. EBITDA Margin Expansion
(Yo Y Growth) (3)
560 bps
REGAL
CINEMAS
amc
THEATRES.
September 2016
...and Superior Flow Through..
Net Investment
Adj. EBITDA Growth
130 bps
REGAL
CINEMAS
$914
$164
CINEMARK
50 bps
CINEMARK
...at Higher Return Rates...
Adj. EBITDA (1) Growth % of Investment
(2011 - H1 2016, $ in mm)
20%
(1)
(2)
(3)
amc
THEATRES.
16%
REGAL
CINEMAS
18%
CINEMARK
...Driving Outsized Growth in Adjusted FCF
36%
increase in
Adjusted FCF (3)
Source: Public filings, US theatre level only, excludes international for Cinemark
Adjusted EBITDA excludes G&A
Net Investment = capex + acquisition costs (net of NCM stock)- asset sales proceeds
LTM ended June 30, 2016 compared to 2015
12View entire presentation