BAT Results Presentation Deck
1
2
BAT
Volume share*
3
Total U.S.
Combustibles
LO
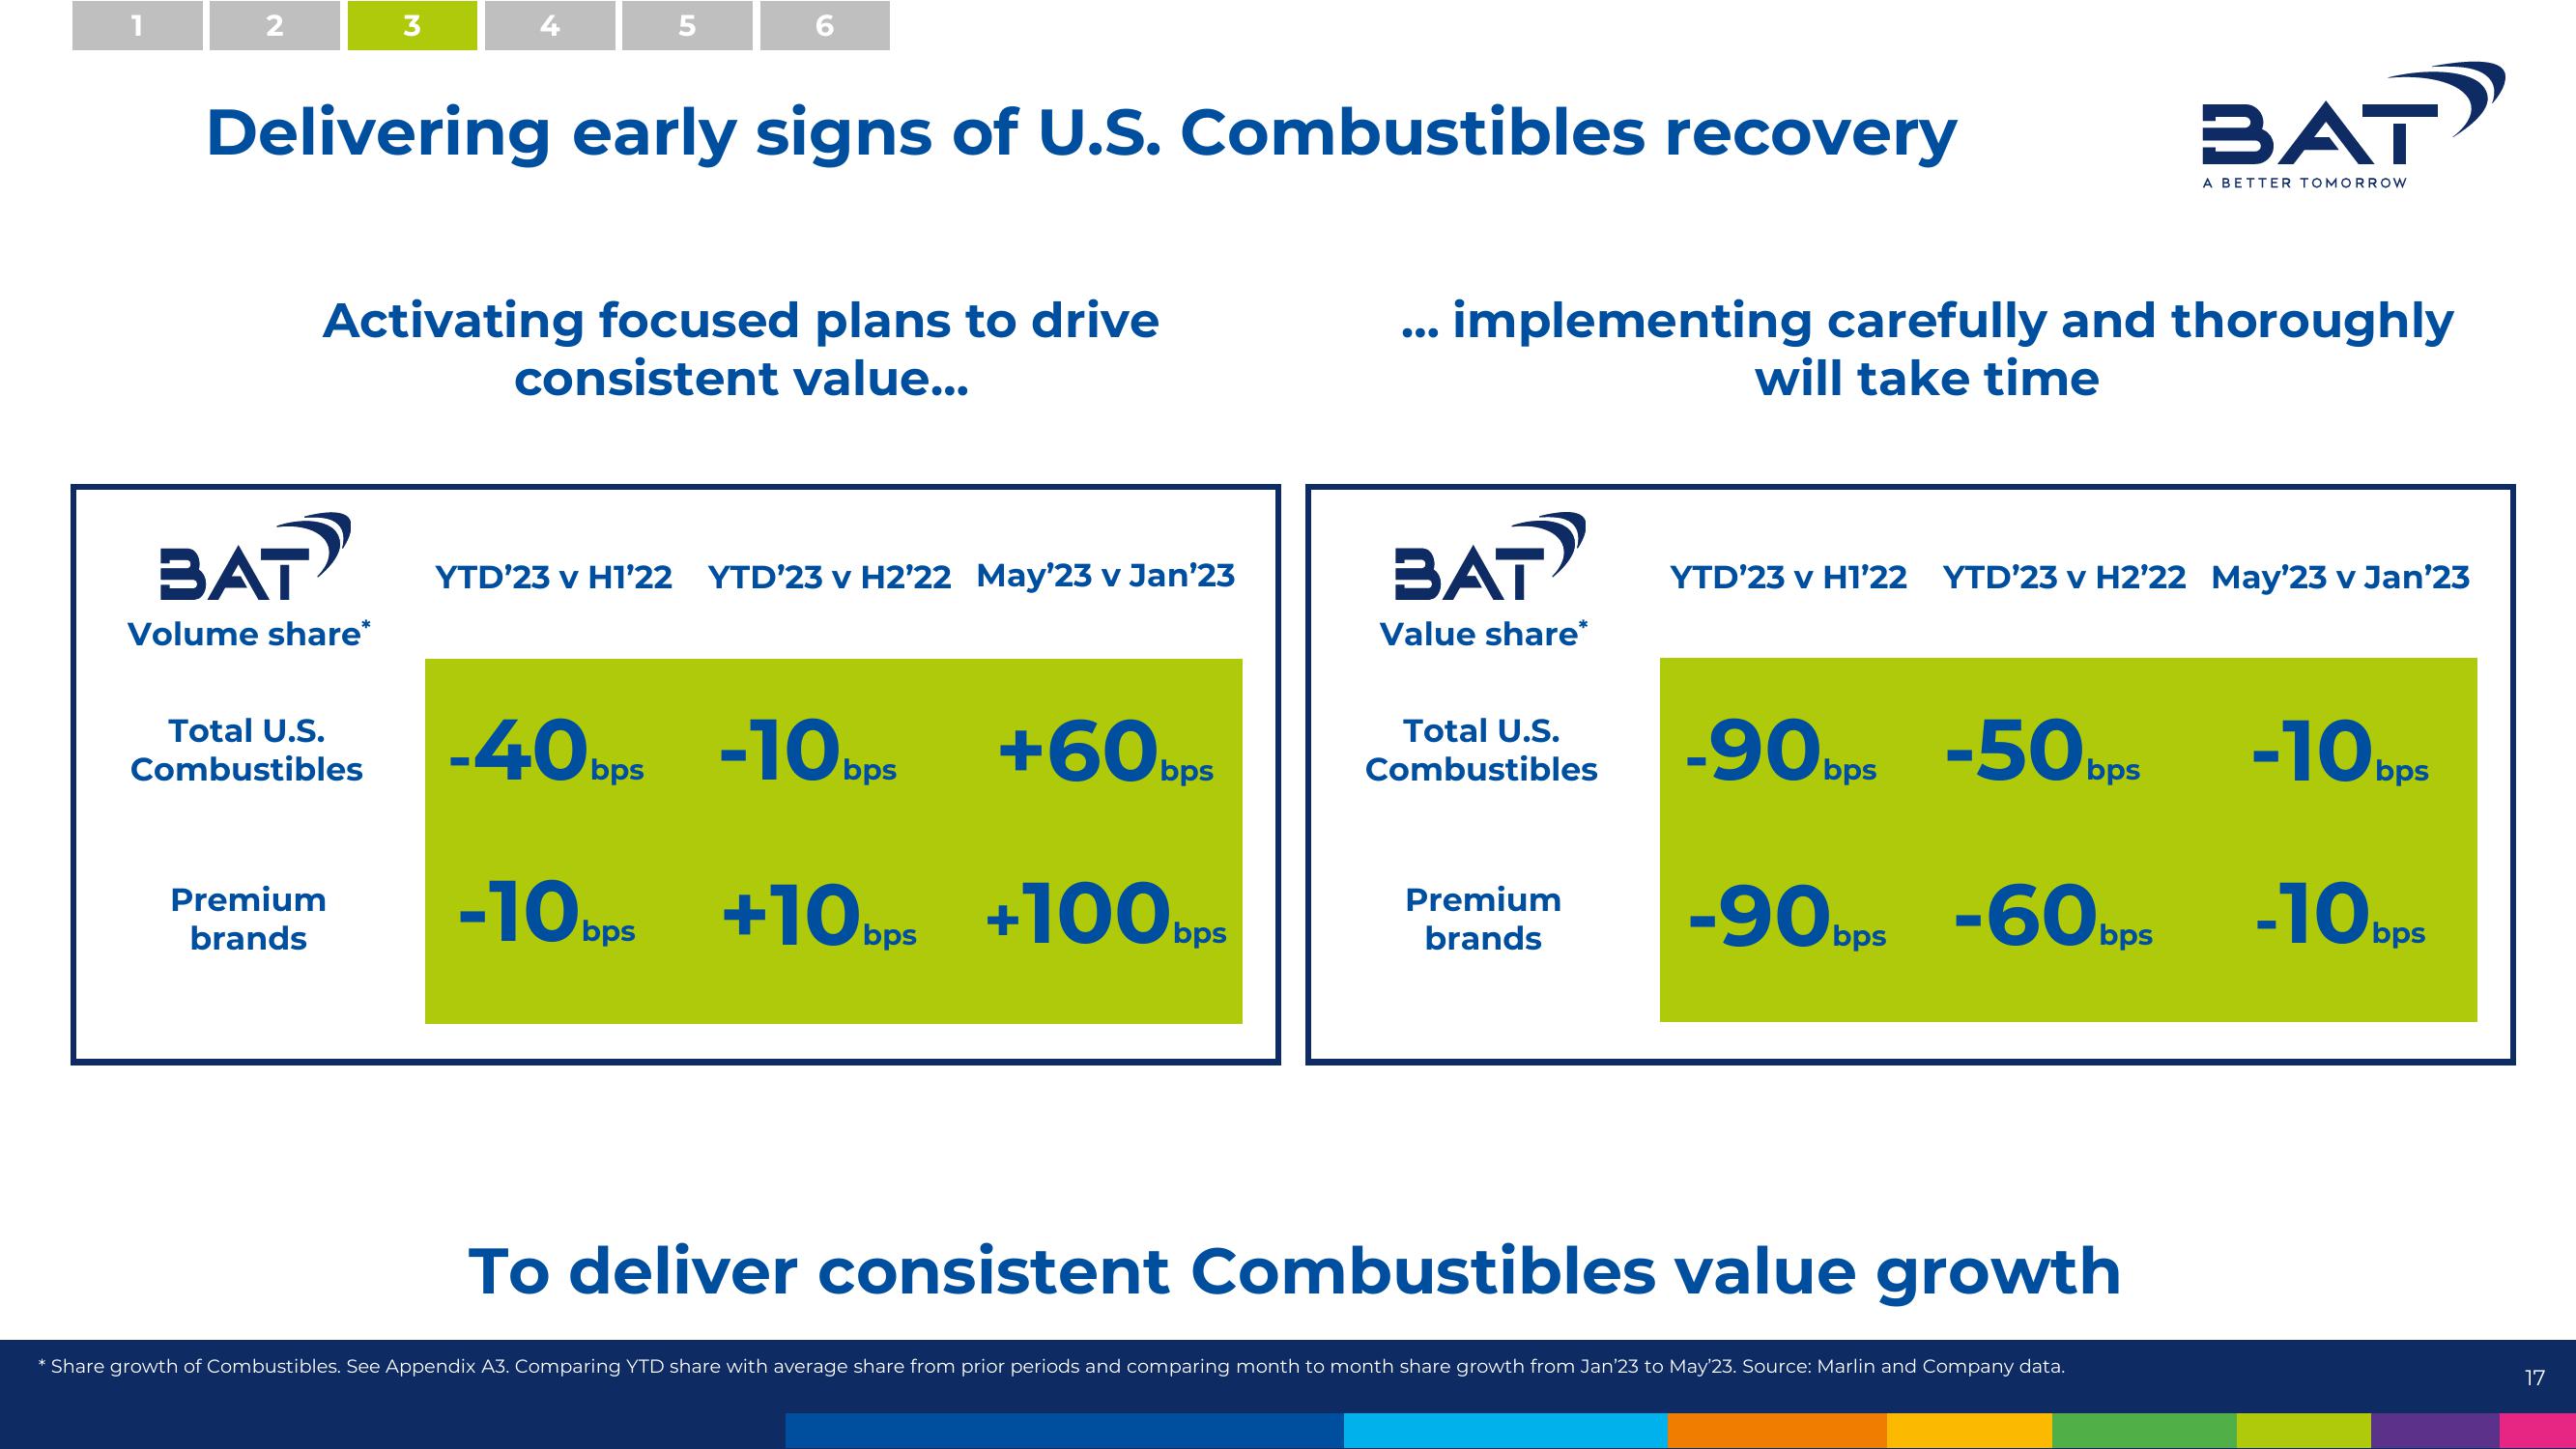
Delivering early signs of U.S. Combustibles recovery
Premium
brands
5
Activating focused plans to drive
consistent value...
6
YTD'23 v H1'22 YTD'23 v H2'22 May'23 v Jan'23
-40bps -10bps +60bps
-10bps +10bps +100bps
.. implementing carefully and thoroughly
will take time
BAT
Value share*
Total U.S.
Combustibles
Premium
brands
YTD'23 v H1'22 YTD'23 v H2'22 May'23 v Jan'23
-90bps -50bps
-90bps -60bps
BAT
A BETTER TOMORROW
To deliver consistent Combustibles value growth
* Share growth of Combustibles. See Appendix A3. Comparing YTD share with average share from prior periods and comparing month to month share growth from Jan'23 to May'23. Source: Marlin and Company data.
-10 bps
-10bps
17View entire presentation