Silicon Valley Bank Results Presentation Deck
Improved client investment fee margin drove robust core fee income growth
Expect high 50s % FY'22 core fee income growth
Core fee income¹
$M
204
22
34
65
svb>
29
20
21
13
Q3'21
SVB Private AUM²
$M
16,512
216
22
38
73
30
20
21
12
Q4'21
6/30/22 AUM
230
22
37
73
30
35
19
14
Q1'22
(76)
Net flows
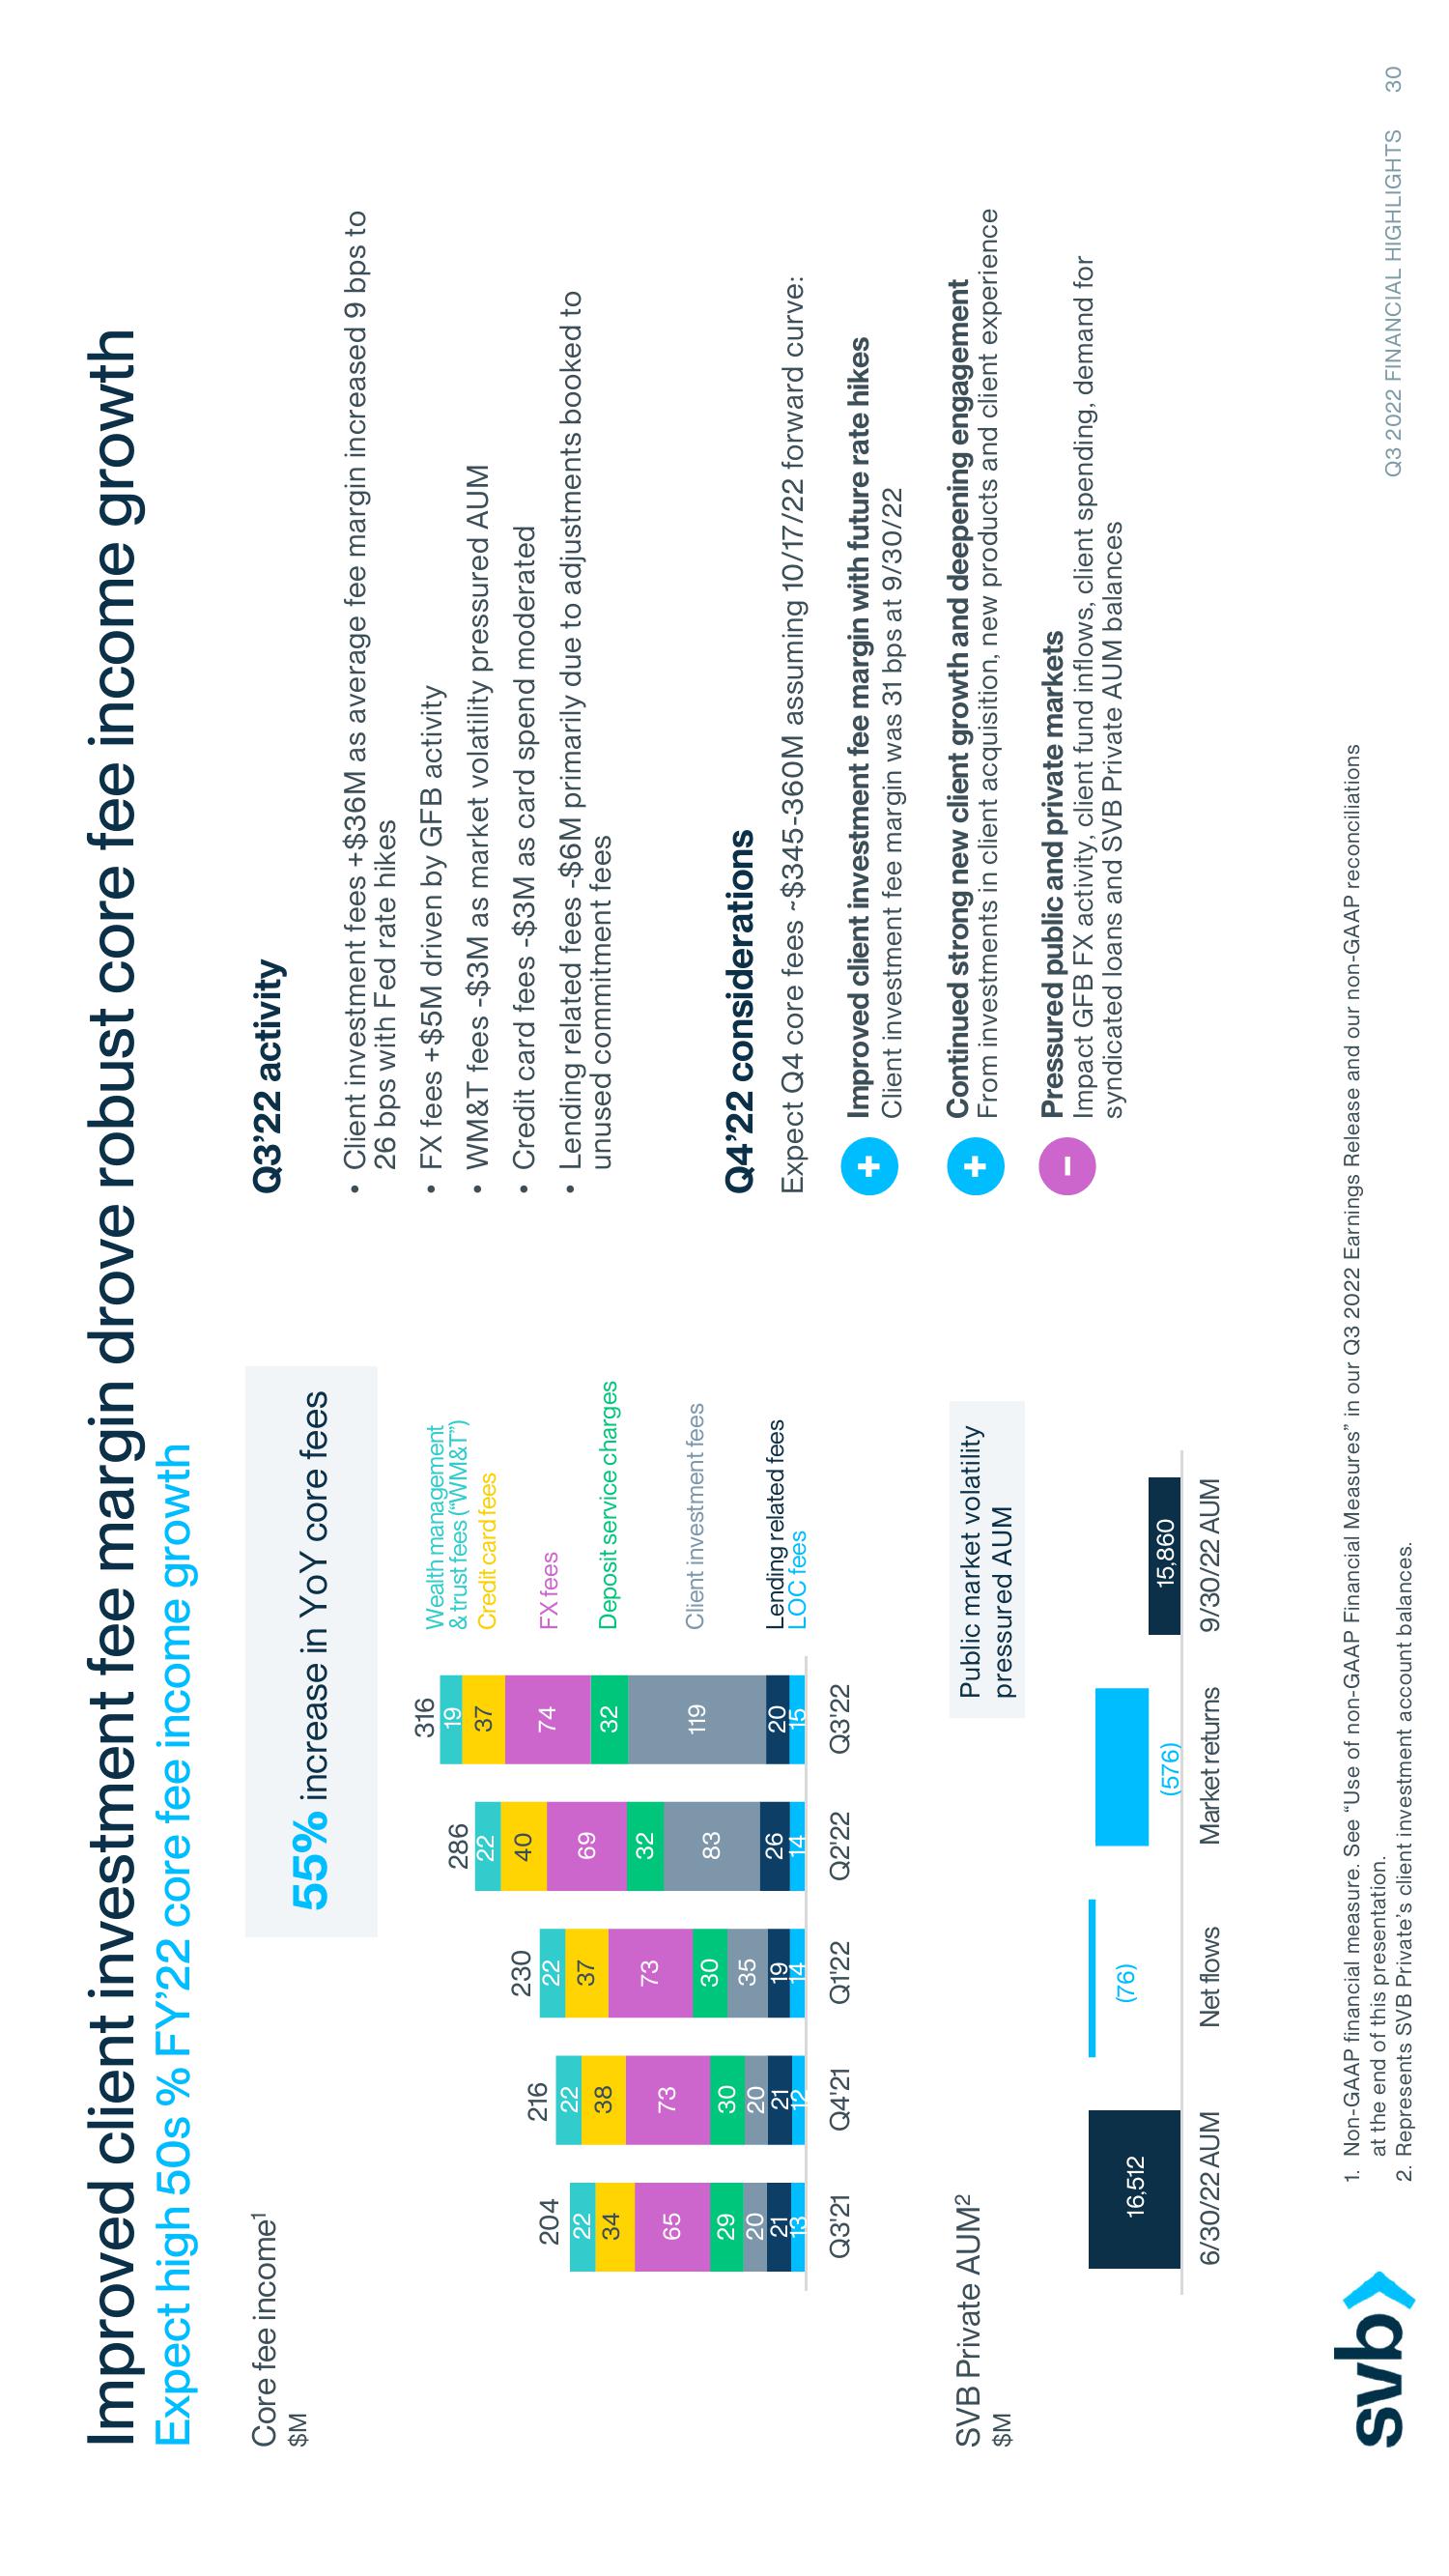
55% increase YoY core fees
286
22
40
69
32
83
26
14
Q2'22
316
19
37
74
32
119
20
15
Q3'22
Wealth management
& trust fees ("WM&T")
Credit card fees
(576)
Market returns
FX fees
Deposit service charges
Client investment fees
Lending related fees
LOC fees
Public market volatility
pressured AUM
15,860
9/30/22 AUM
Q3'22 activity
Client investment fees +$36M as average fee margin increased 9 bps to
26 bps with Fed rate hikes
FX fees +$5M driven by GFB activity
●
●
• WM&T fees -$3M as market volatility pressured AUM
• Credit card fees -$3M as card spend moderated
• Lending related fees -$6M primarily due to adjustments booked to
unused commitment fees
Q4'22 considerations
Expect Q4 core fees ~$345-360M assuming 10/17/22 forward curve:
Improved client investment fee margin with future rate hikes
Client investment fee margin was 31 bps at 9/30/22
Continued strong new client growth and deepening engagement
From investments in client acquisition, new products and client experience
Pressured public and private markets
Impact GFB FX activity, client fund inflows, client spending, demand for
syndicated loans and SVB Private AUM balances
1. Non-GAAP financial measure. See "Use of non-GAAP Financial Measures" in our Q3 2022 Earnings Release and our non-GAAP reconciliations
at the end of this presentation.
2. Represents SVB Private's client investment account balances.
Q3 2022 FINANCIAL HIGHLIGHTS
30View entire presentation