Pathward Financial Results Presentation Deck
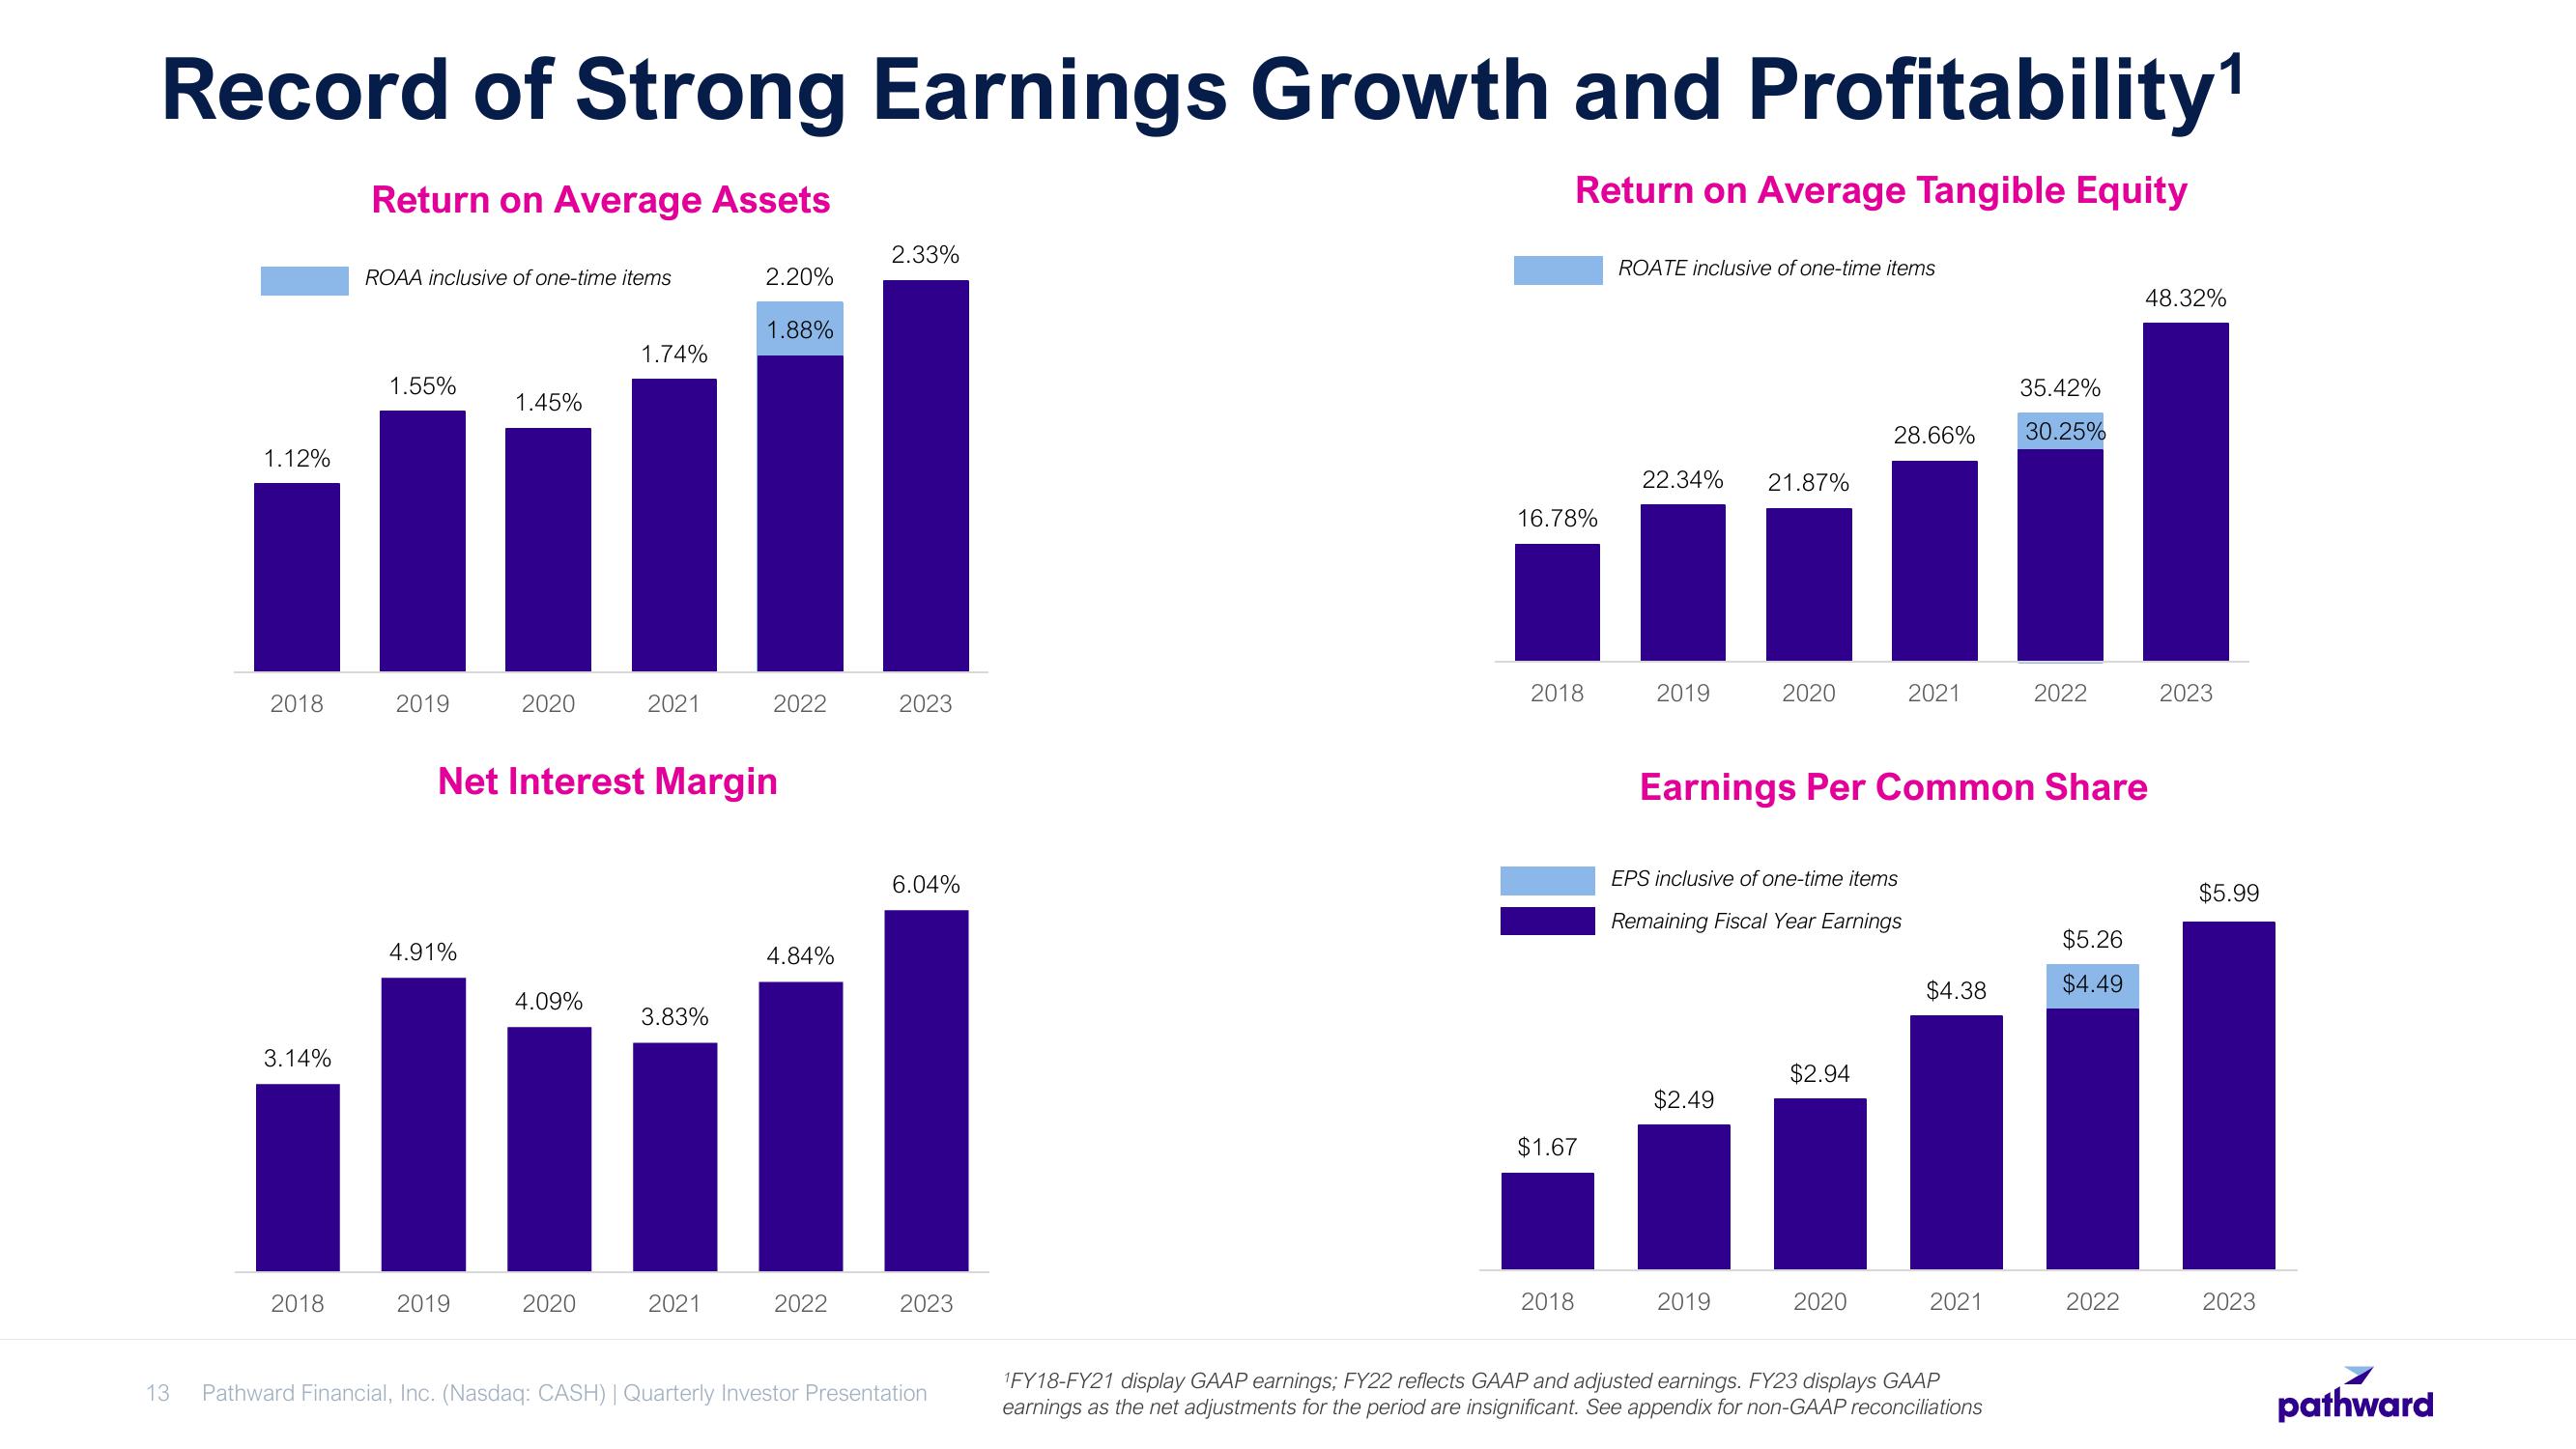
Record of Strong Earnings Growth and Profitability¹
Return on Average Assets
Return on Average Tangible Equity
13
1.12%
2018
3.14%
2018
ROAA inclusive of one-time items
1.55%
2019
4.91%
1.45%
2019
2020
4.09%
1.74%
2020
2021
Net Interest Margin
3.83%
2.20%
2021
1.88%
2022
4.84%
2022
2.33%
2023
6.04%
2023
Pathward Financial, Inc. (Nasdaq: CASH) | Quarterly Investor Presentation
16.78%
2018
$1.67
2018
ROATE inclusive of one-time items
22.34%
2019
21.87%
$2.49
2020
2019
EPS inclusive of one-time items
Remaining Fiscal Year Earnings
28.66%
$2.94
Earnings Per Common Share
2020
2021
$4.38
2021
35.42%
30.25%
1FY18-FY21 display GAAP earnings; FY22 reflects GAAP and adjusted earnings. FY23 displays GAAP
earnings as the net adjustments for the period are insignificant. See appendix for non-GAAP reconciliations
2022
$5.26
$4.49
48.32%
2022
2023
$5.99
2023
pathwardView entire presentation