Bed Bath & Beyond Results Presentation Deck
FISCAL 2021 OUTLOOK
fiscal 2021: robust foundation to successfully execute 3-year growth
plan; reaffirming sales & adjusted ebitda outlook; increasing
shareholder returns
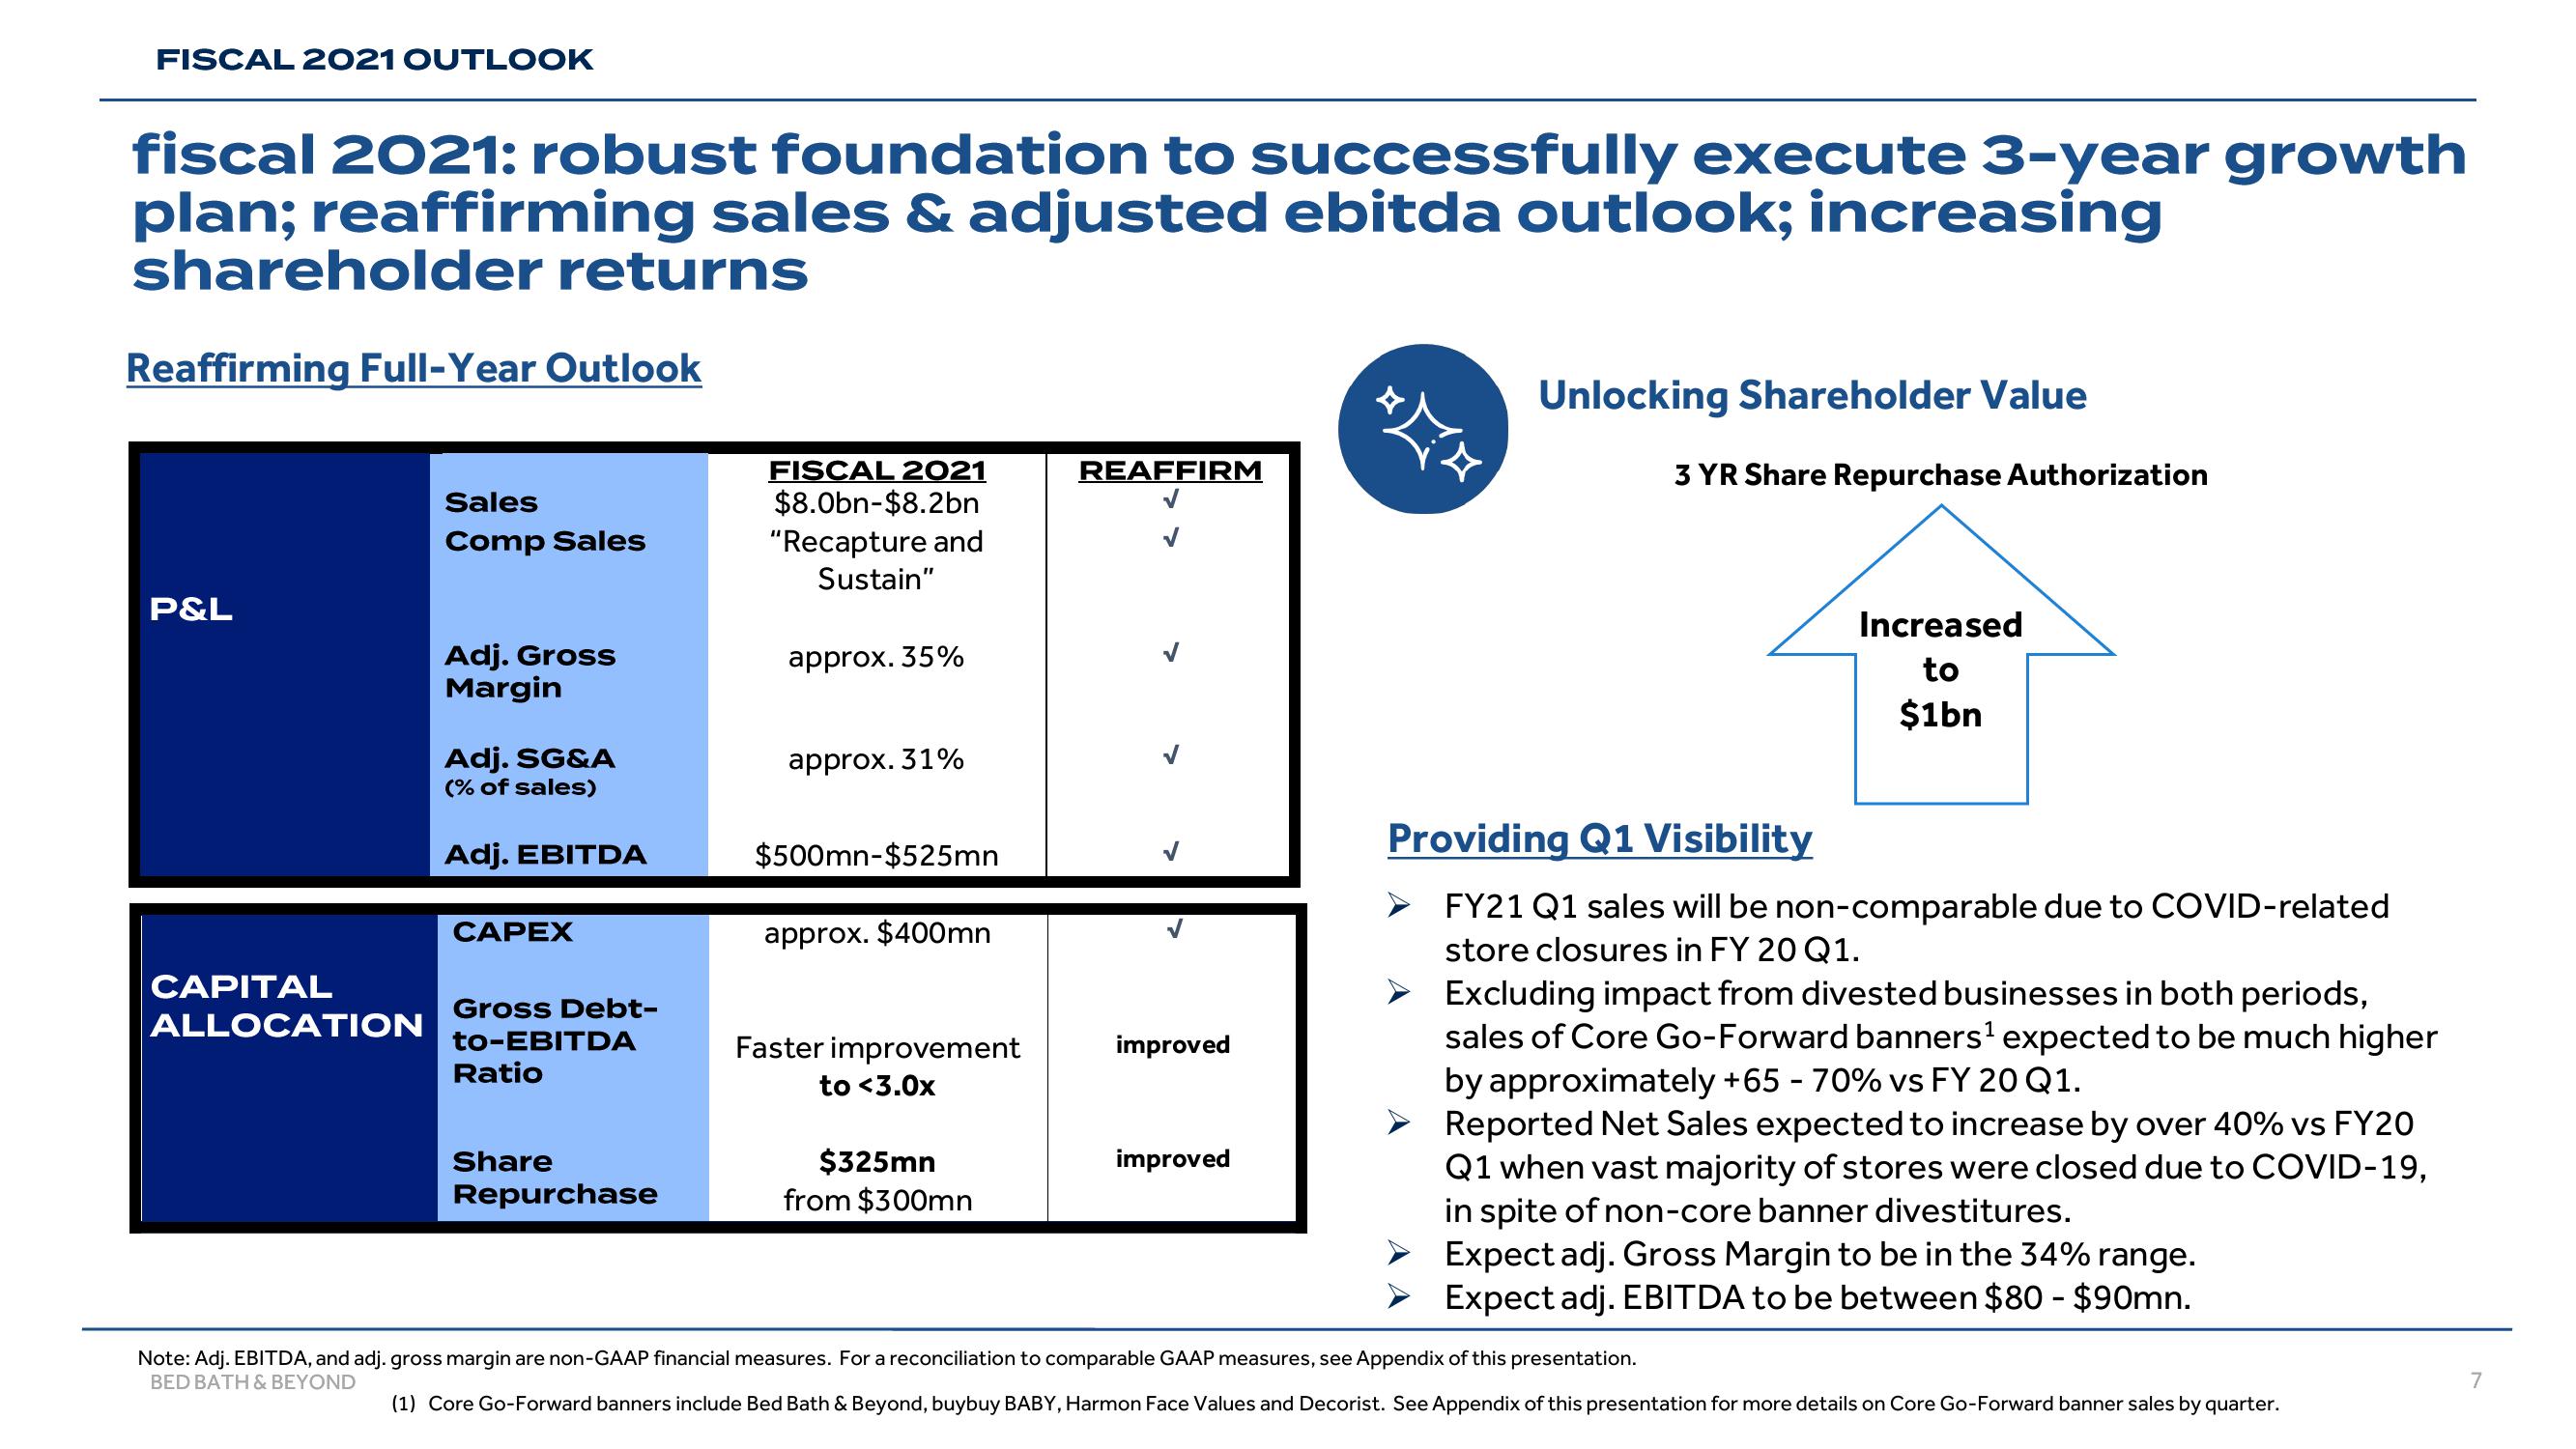
Reaffirming Full-Year Outlook
P&L
CAPITAL
ALLOCATION
Sales
Comp Sales
Adj. Gross
Margin
Adj. SG&A
(% of sales)
Adj. EBITDA
CAPEX
Gross Debt-
to-EBITDA
Ratio
Share
Repurchase
FISCAL 2021
$8.0bn-$8.2bn
"Recapture and
Sustain"
approx. 35%
approx. 31%
$500mn-$525mn
approx. $400mn
Faster improvement
to <3.0x
$325mn
from $300mn
REAFFIRM
improved
improved
¤¤
Unlocking Shareholder Value
3 YR Share Repurchase Authorization
Increased
to
$1bn
Providing Q1 Visibility
FY21 Q1 sales will be non-comparable due to COVID-related
store closures in FY 20 Q1.
Excluding impact from divested businesses in both periods,
sales of Core Go-Forward banners¹ expected to be much higher
by approximately +65 - 70% vs FY 20 Q1.
Reported Net Sales expected to increase by over 40% vs FY20
Q1 when vast majority of stores were closed due to COVID-19,
in spite of non-core banner divestitures.
Expect adj. Gross Margin to be in the 34% range.
➤ Expect adj. EBITDA to be between $80 - $90mn.
Note: Adj. EBITDA, and adj. gross margin are non-GAAP financial measures. For a reconciliation to comparable GAAP measures, see Appendix of this presentation.
BED BATH & BEYOND
(1) Core Go-Forward banners include Bed Bath & Beyond, buybuy BABY, Harmon Face Values and Decorist. See Appendix of this presentation for more details on Core Go-Forward banner sales by quarter.
7View entire presentation