Tradeweb Investor Presentation Deck
3. POWERFUL GROWTH THEMES
Expansive and Growing Addressable Markets
TRADEWEB'S GROWTH ADVANTAGE
सव
IN
12
GROWTH IN EXISTING MARKETS
ELECTRONIFICATION OF MARKETS
INCREASE MARKET SHARE
GROWTH IN UNDERLYING
ASSET CLASSES
ENHANCE DATA AND
ANALYTICS CAPABILITIES
ENTER NEW MARKETS AND OTHER
DRIVERS OF LONG-TERM GROWTH
NEW ASSET CLASSES
NEW REGIONS AND CLIENTS
STRATEGIC ACQUISITIONS
AND PARTNERSHIPS
Ⓒ2022 Tradeweb Markets LLC. All rights reserved.
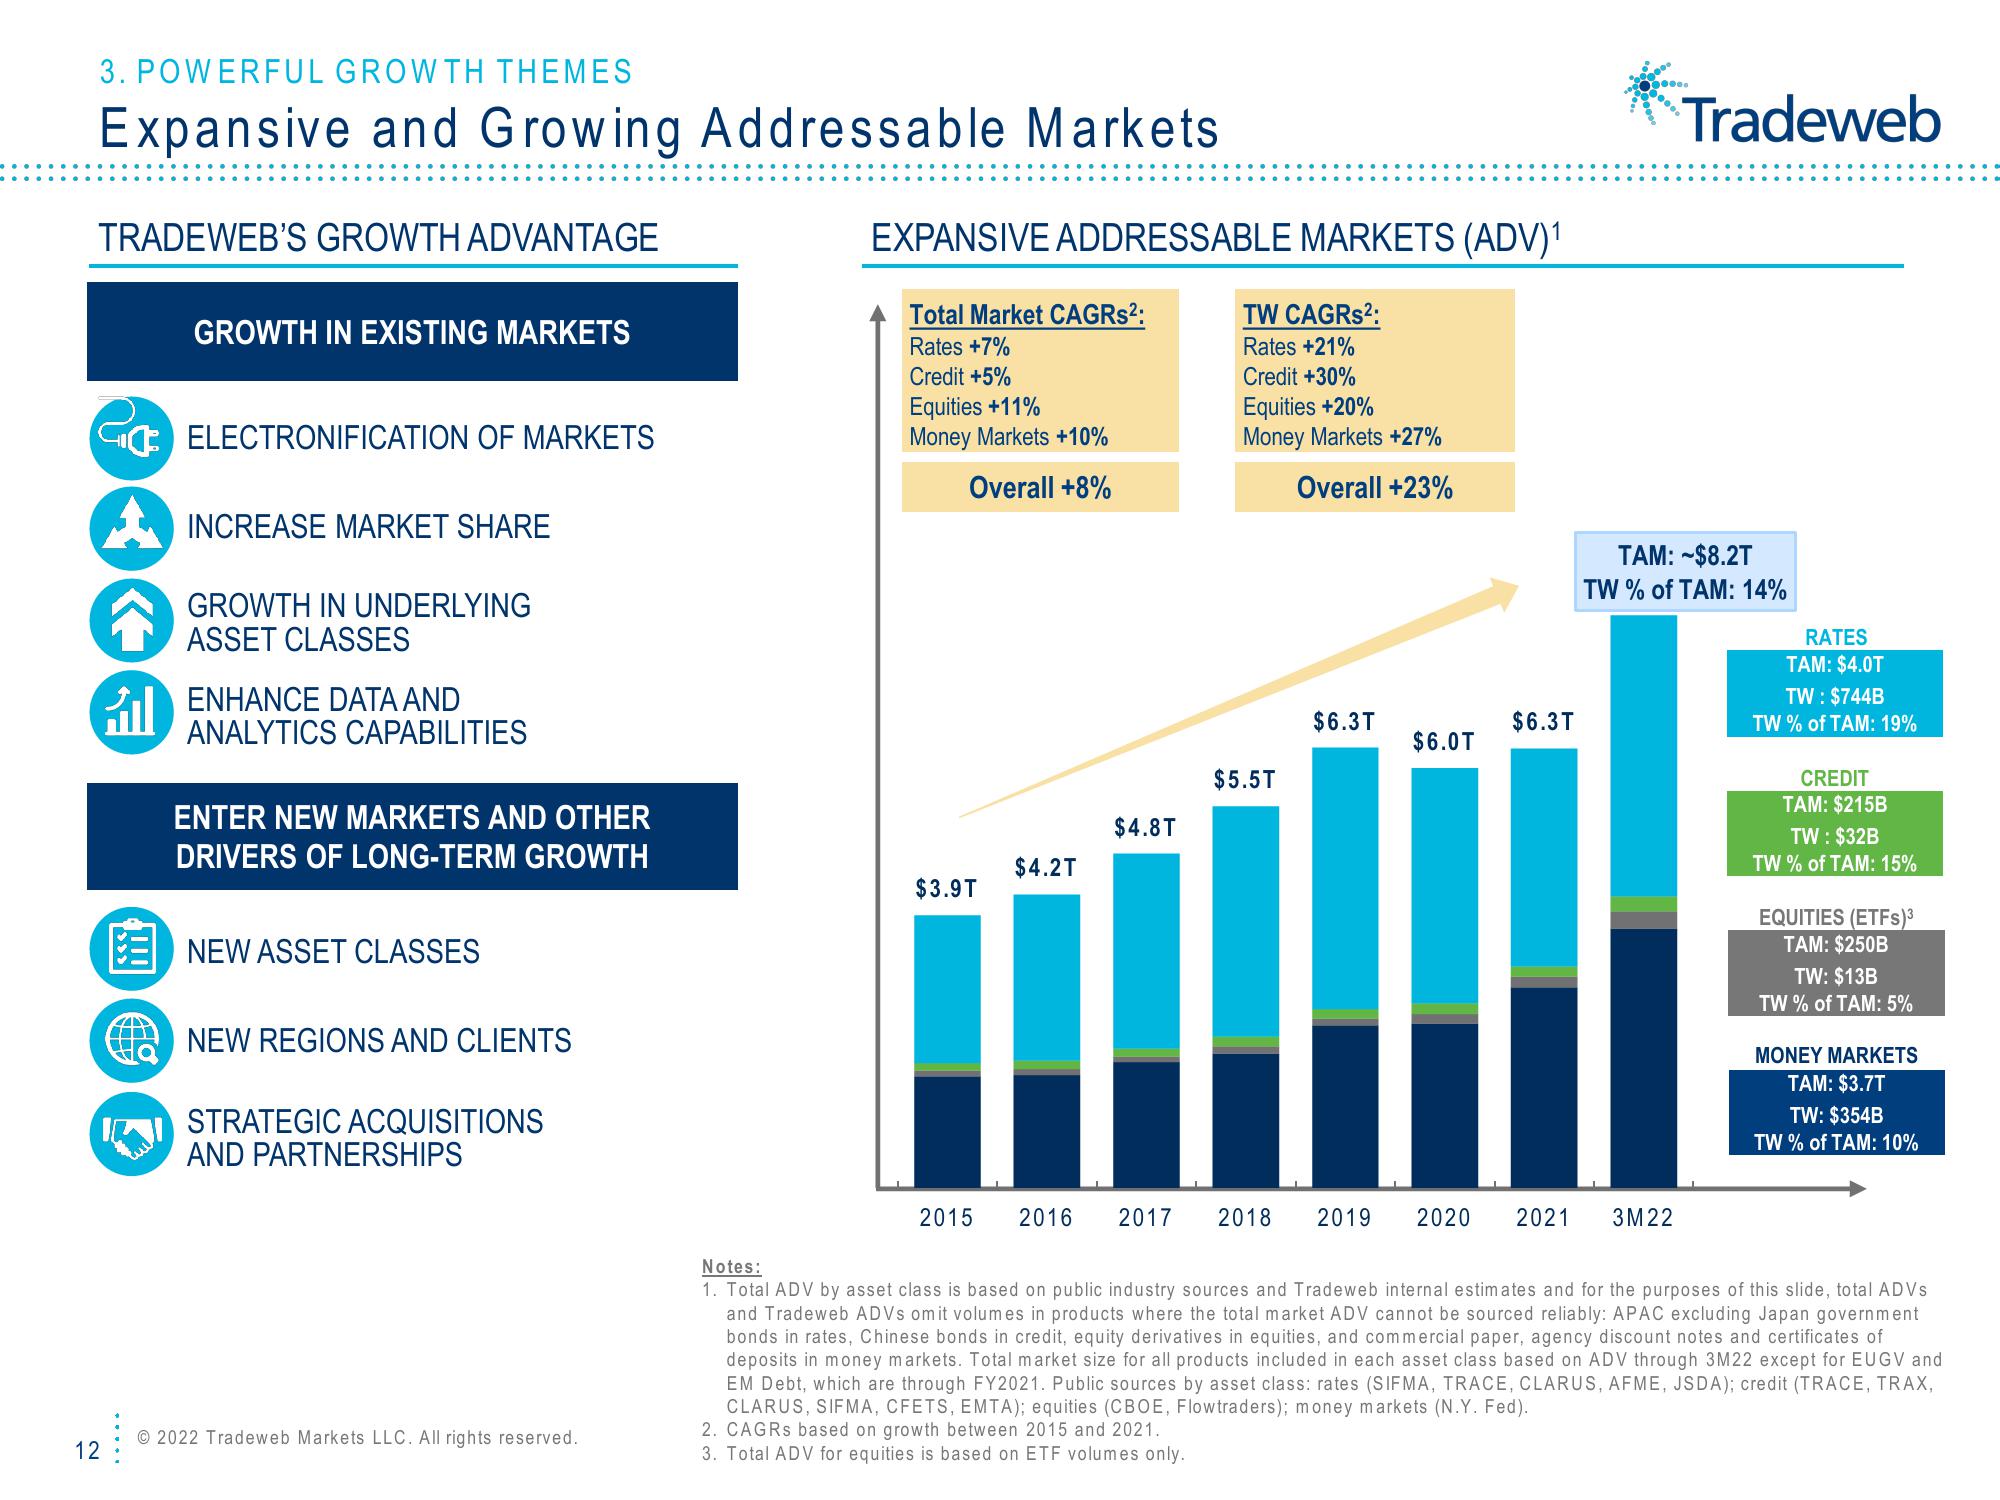
EXPANSIVE ADDRESSABLE MARKETS (ADV)¹
Total Market CAGRs²:
Rates +7%
Credit +5%
Equities +11%
Money Markets +10%
Overall +8%
$3.9T
2015
$4.2T
$4.8T
TW CAGRs²:
Rates +21%
Credit +30%
Equities +20%
Money Markets +27%
Overall +23%
$5.5T
2016 2017 2018
$6.3T
$6.0T
$6.3T
....
Tradeweb
TAM:~$8.2T
TW% of TAM: 14%
2019 2020 2021 3M22
RATES
TAM: $4.0T
TW: $744B
TW% of TAM: 19%
CREDIT
TAM: $215B
TW: $32B
TW% of TAM: 15%
EQUITIES (ETFs)³
TAM: $250B
TW: $13B
TW% of TAM: 5%
MONEY MARKETS
TAM: $3.7T
TW: $354B
TW % of TAM: 10%
Notes:
1. Total ADV by asset class is based on public industry sources and Tradeweb internal estimates and for the purposes of this slide, total ADVS
and Tradeweb ADVs omit volumes in products where the total market ADV cannot be sourced reliably: APAC excluding Japan government
bonds in rates, Chinese bonds in credit, equity derivatives in equities, and commercial paper, agency discount notes and certificates of
deposits in money markets. Total market size for all products included in each asset class based on ADV through 3M22 except for EUGV and
EM Debt, which are through FY2021. Public sources by asset class: rates (SIFMA, TRACE, CLARUS, AFME, JSDA); credit (TRACE, TRAX,
CLARUS, SIFMA, CFETS, EMTA); equities (CBOE, Flowtraders); money markets (N.Y. Fed).
2. CAGRS based on growth between 2015 and 2021.
3. Total ADV for equities is based on ETF volumes only.View entire presentation