Fastly Investor Day Presentation Deck
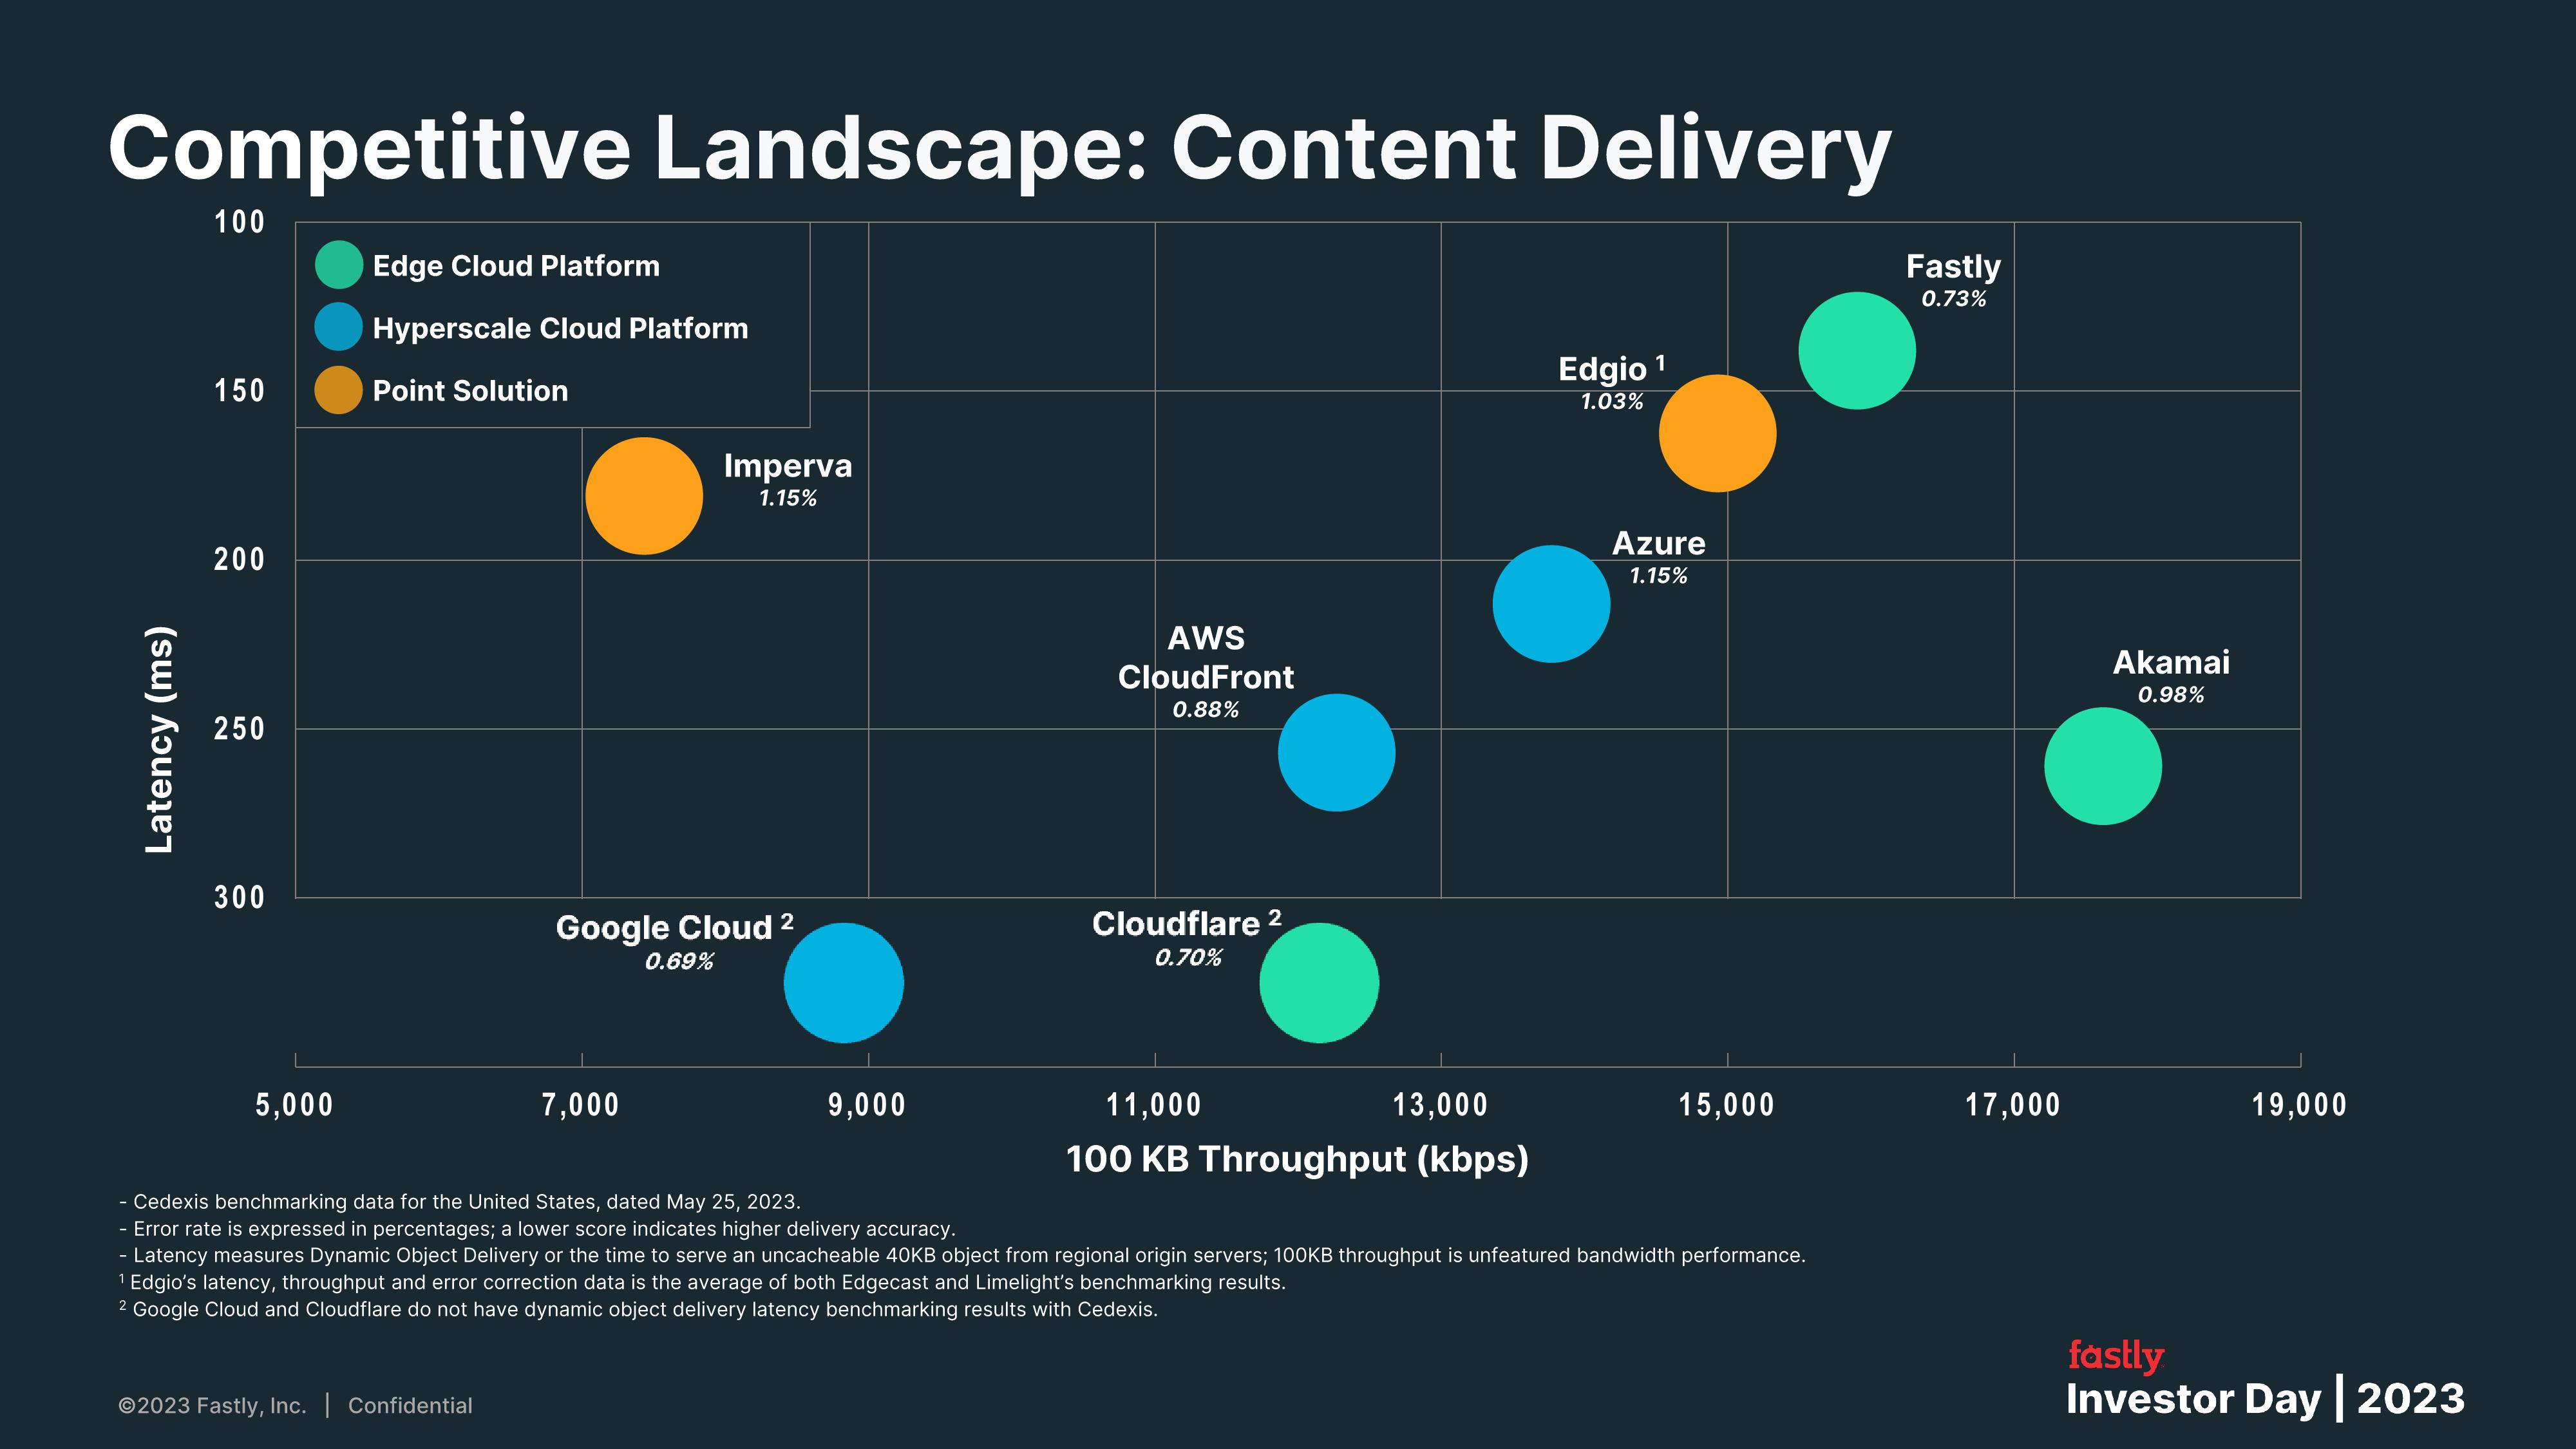
Competitive Landscape: Content Delivery
Latency (ms)
100
150
200
250
300
5,000
Edge Cloud Platform
Hyperscale Cloud Platform
Point Solution
Ⓒ2023 Fastly, Inc. | Confidential
Imperva
1.15%
Google Cloud 2
0.69%
7,000
9,000
AWS
CloudFront
0.88%
Cloudflare 2
0.70%
11,000
13,000
100 KB Throughput (kbps)
Edgio ¹
1.03%
Azure
1.15%
15,000
Cedexis benchmarking data for the United States, dated May 25, 2023.
- Error rate is expressed in percentages; a lower score indicates higher delivery accuracy.
- Latency measures Dynamic Object Delivery or the time to serve an uncacheable 40KB object from regional origin servers; 100KB throughput is unfeatured bandwidth performance.
¹ Edgio's latency, throughput and error correction data is the average of both Edgecast and Limelight's benchmarking results.
2 Google Cloud and Cloudflare do not have dynamic object delivery latency benchmarking results with Cedexis.
Fastly
0.73%
17,000
Akamai
0.98%
19,000
fastly
Investor Day | 2023View entire presentation