Baird Investment Banking Pitch Book
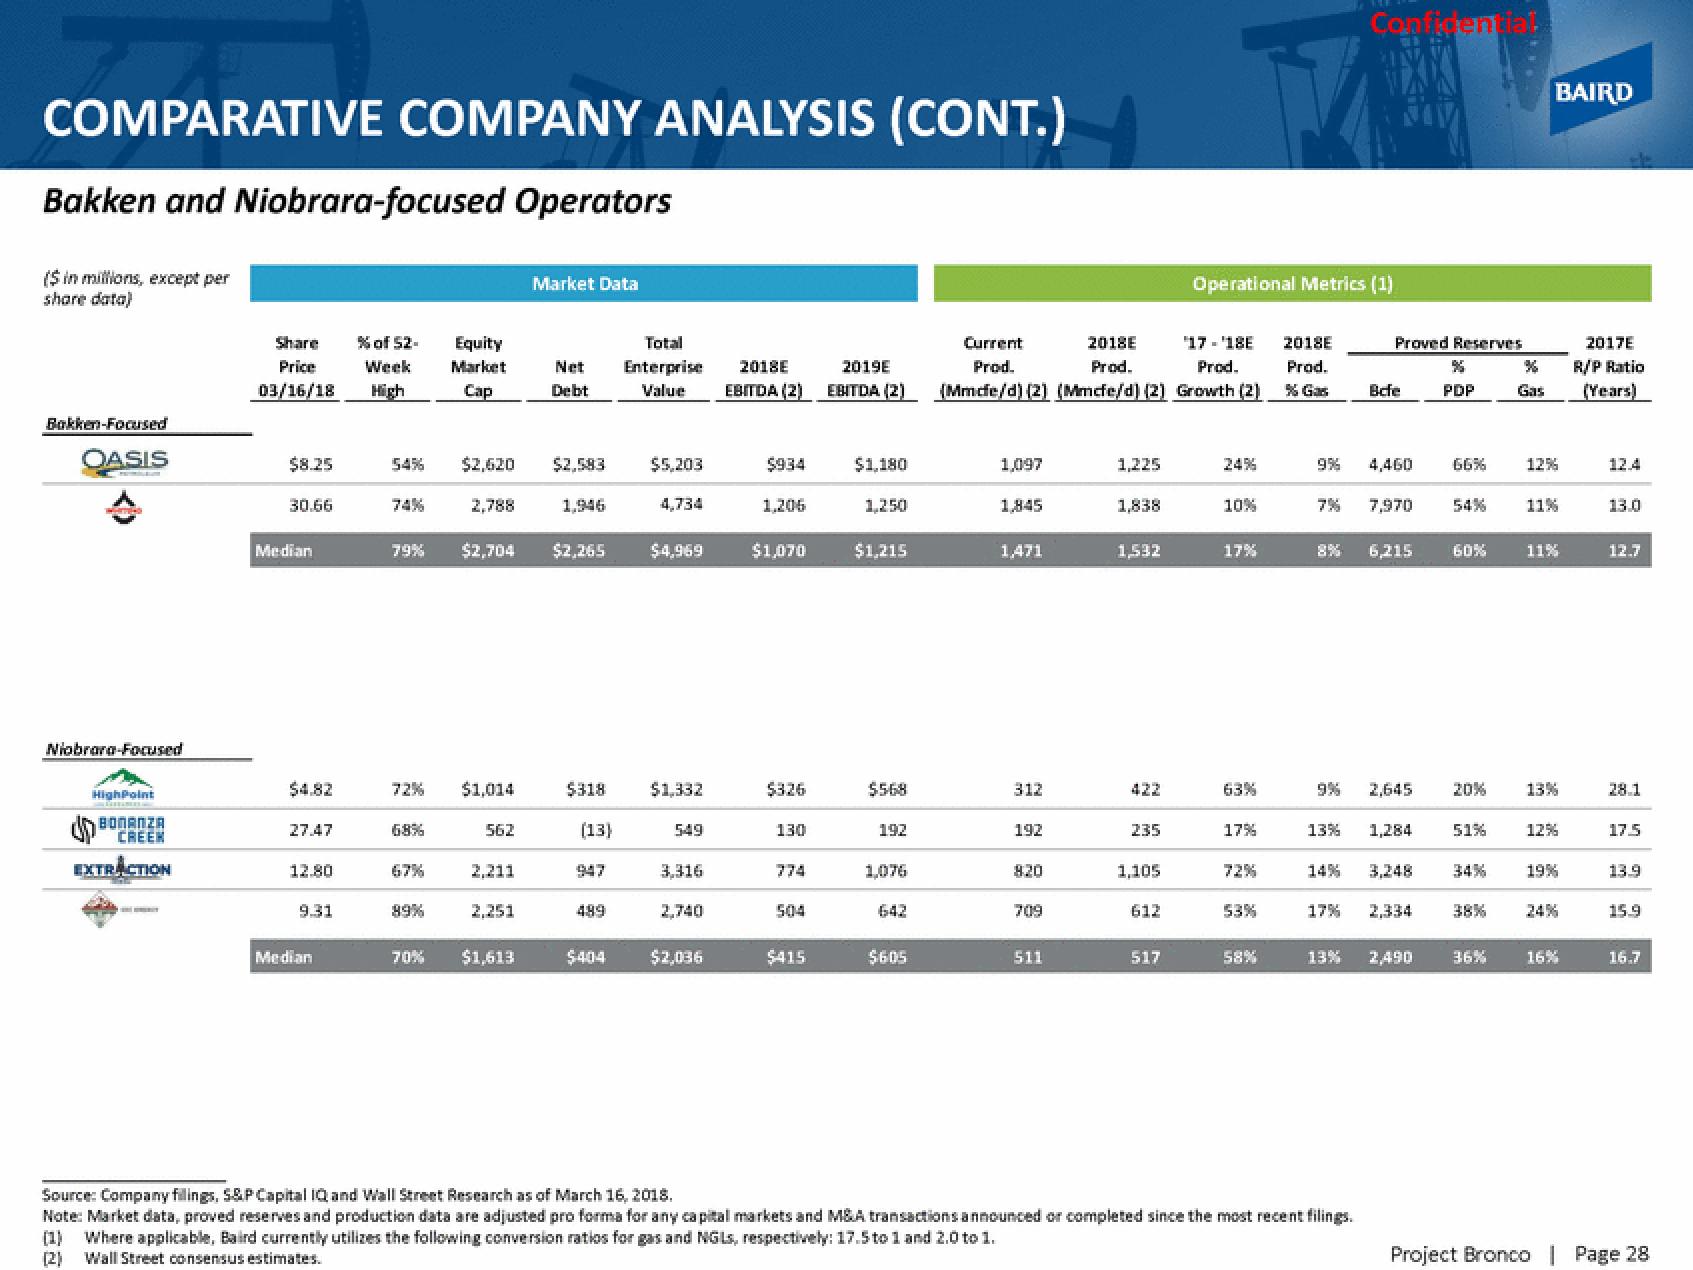
COMPARATIVE COMPANY ANALYSIS (CONT.)
Bakken and Niobrara-focused Operators
($ in millions, except per
share data)
Bakken-Focused
OASIS
Niobrara-Focused
HighPoint
CREEK
EXTRACTION
Share
Price
03/16/18
$8.25
30.66
Median
$4.82
27.47
12.80
9.31
Median
% of 52-
Week
High
74%
545% $2,620 $2,583
Equity
Market
Cap
68%
72% $1,014
67%
2,788
89%
79% $2,704 $2,265
562
2,211
Market Data
2,251
Net
Debt
70% $1,613
1,946
$318
(13)
947
489
$404
Total
Enterprise
2018E
Value EBITDA (2)
$5,203
4,734
$4,969
$1,332
549
3,316
2,740
$2,036
$934
1,206
$1,070
$326
130
774
504
$415
2019E
EBITDA (2)
$1,180
1.250
$1,215
$568
192
1,076
$605
Current
2018E
'17-'18E
Prod.
Prod.
Prod.
(Mmcfe/d) (2) (Mmcfe/d) (2) Growth (2)
1,097
1,845
1,471
312
192
820
709
511
1,225
1,838
1,532
235
1,105
612
517
Operational Metrics (1)
24%
10%
17%
63%
17%
53%
58%
2018E
Prod.
% Gas
9%
Confident
Proved Reserves
Befe
17%
4,460
8% 6,215
7,970
9% 2,645
Source: Company fillings, S&P Capital IQ and Wall Street Research as of March 16, 2018.
Note: Market data, proved reserves and production data are adjusted pro forma for any capital markets and M&A transactions announced or completed since the most recent filings.
(1) Where applicable, Baird currently utilizes the following conversion ratios for gas and NGLs, respectively: 17.5 to 1 and 2.0 to 1.
(2)
Wall Street consensus estimates.
13% 1,284
14% 3,248
2,334
13% 2,490
%
PDP
66%
60%
20%
51%
38%
36%
%6
Gas
BAIRD
12%
11%
11%
13%
12%
19%
16%
2017E
R/P Ratio
(Years)
13.0
12.7
28.1
17.5
13.9
15.9
16.7
Project Bronco | Page 28View entire presentation