Experian ESG Presentation Deck
Executive Summary
Improving Financial Health
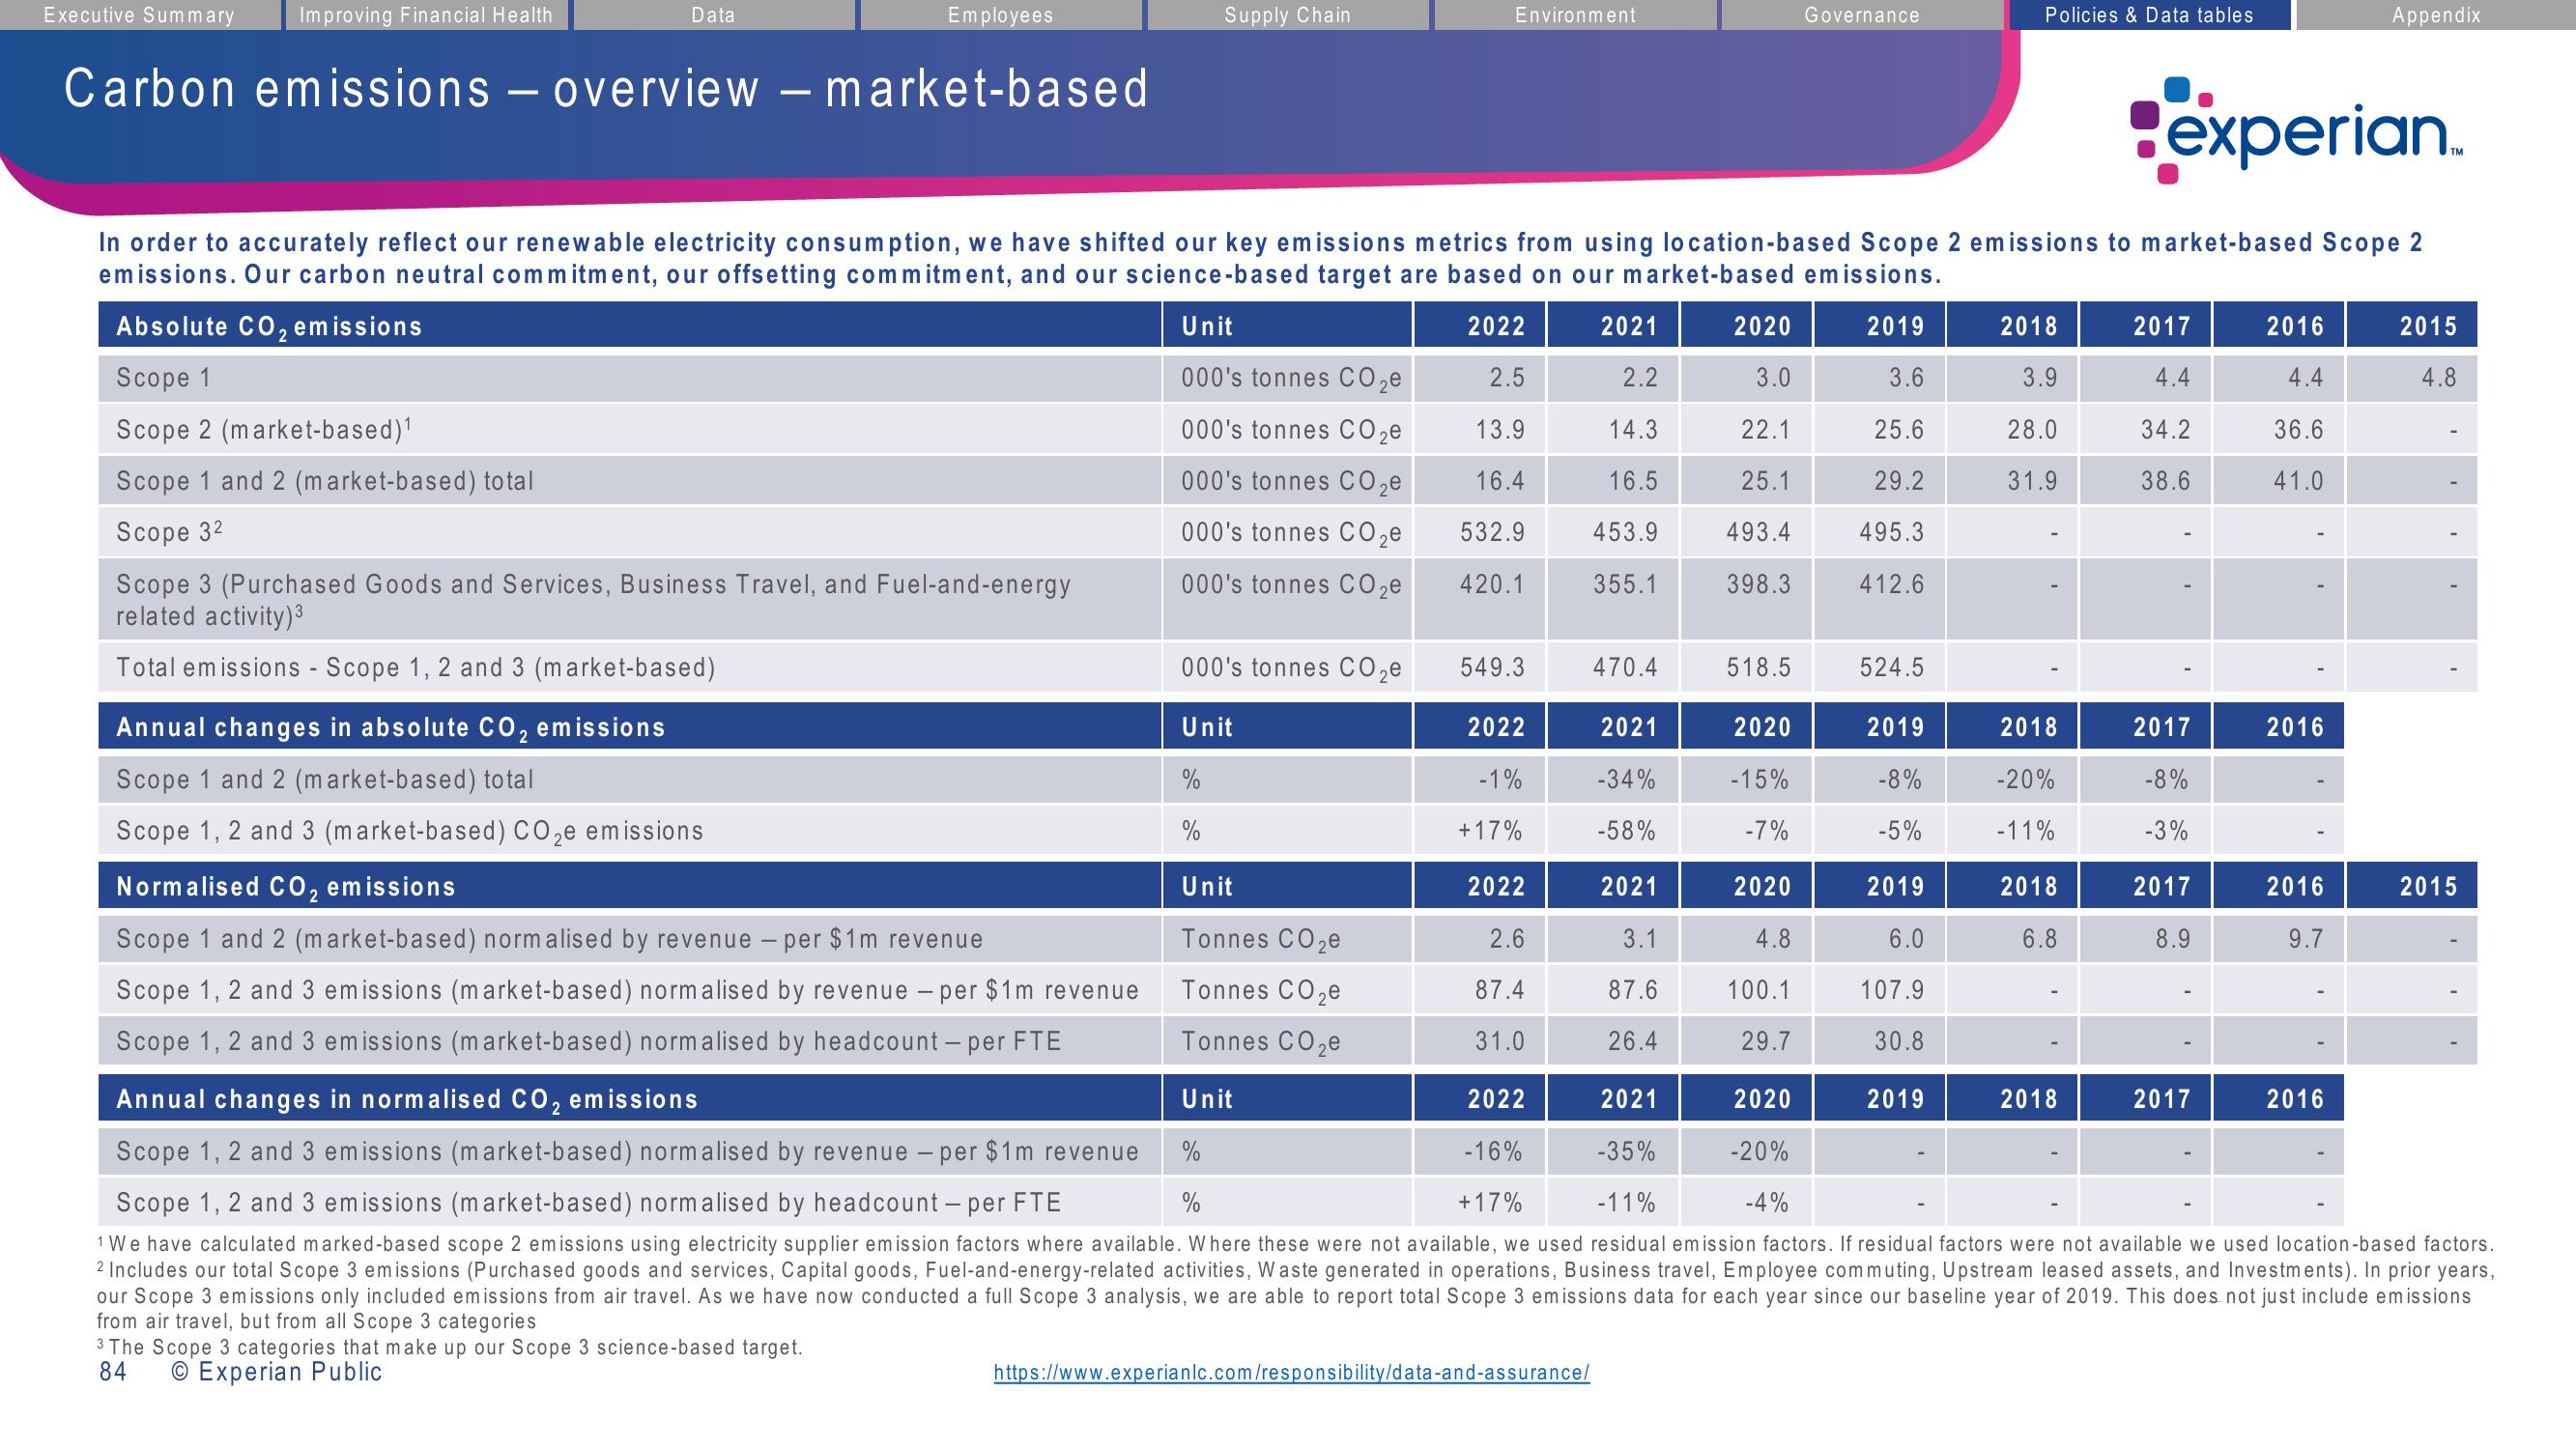
Carbon emissions - overview - market-based
Data
Absolute CO₂ emissions
2
Scope 1
Scope 2 (market-based)¹
Scope 1 and 2 (market-based) total
Scope 3²
Employees
Scope 3 (Purchased Goods and Services, Business Travel, and Fuel-and-energy
related activity) ³
Total emissions - Scope 1, 2 and 3 (market-based)
Annual changes in absolute CO₂ emissions
Scope 1 and 2 (market-based) total
Scope 1, 2 and 3 (market-based) CO₂e emissions
experian
In order to accurately reflect our renewable electricity consumption, we have shifted our key emissions metrics from using location-based Scope 2 emissions to market-based Scope 2
emissions. Our carbon neutral commitment, our offsetting commitment, and our science-based target are based on our market-based emissions.
Unit
2022
2019
3.6
000's tonnes CO₂e
000's tonnes CO₂e
000's tonnes CO₂e
000's tonnes CO₂e
2.5
13.9
16.4
532.9
420.1
25.6
29.2
495.3
412.6
000's tonnes CO₂e
Normalised CO₂ emissions
Scope 1 and 2 (market-based) normalised by revenue - per $1m revenue
Scope 1, 2 and 3 emissions (market-based) normalised by revenue - per $1m revenue
Scope 1, 2 and 3 emissions (market-based) normalised by headcount - per FTE
3 The Scope 3 categories that make up our Scope 3 science-based target.
84
O Experian Public
Supply Chain
000's tonnes CO₂e
Unit
%
Environment
549.3
2022
-1%
+17%
2022
2.6
87.4
31.0
2021
2.2
https://www.experianlc.com/responsibility/data-and-assurance/
14.3
16.5
453.9
355.1
470.4
2021
-34%
-58%
2021
3.1
87.6
26.4
2020
3.0
22.1
25.1
493.4
398.3
518.5
2020
-15%
-7%
Governance
2020
4.8
100.1
29.7
524.5
2019
-8%
-5%
Policies & Data tables
2019
6.0
107.9
30.8
2019
2018
3.9
28.0
31.9
2018
-20%
-11%
2018
6.8
2017
4.4
34.2
38.6
2018
1
2017
-8%
-3%
Unit
Tonnes CO₂e
Tonnes CO₂e
Tonnes CO₂e
Annual changes in normalised CO₂ emissions
Unit
2022
2021
2020
%
-16%
-35%
-20%
Scope 1, 2 and 3 emissions (market-based) normalised by revenue - per $1m revenue
Scope 1, 2 and 3 emissions (market-based) normalised by headcount - per FTE
%
+17%
-11%
-4%
were not available, we used residual emission factors. esidu factors were not available we used
tion-based factors.
1 We have calculated marked-based scope 2 em using electricity supplier emission factors where available. Where
2 Includes our total Scope 3 emissions (Purchased goods and services, Capital goods, Fuel-and-energy-related activities, Waste generated in operations, Business travel, Employee commuting, Upstream leased assets, and Investments). In prior years,
our Scope 3 emissions only included emissions from air travel. As we have now conducted a full Scope 3 analysis, we are able to report total Scope 3 emissions data for each year since our baseline year of 2019. This does not just include emissions
from air travel, but from all Scope 3 categories
2017
8.9
2016
4.4
36.6
41.0
2017
I
1
2016
Appendix
2016
9.7
2016
TM
2015
4.8
1
2015View entire presentation