THOR Industries Results Presentation Deck
NORTH AMERICAN
TOWABLE SEGMENT
Fourth Quarter of
Fiscal 2022
NORTH AMERICAN TOWABLE
KEY DRIVERS
THO
LISTED
NYSE
Dealer inventory levels generally
at normalized levels
Backlog of $2.6 billion remains
above pre-pandemic levels with
continued demand amid
macroeconomic uncertainty
Increased market share 10 bps
to 40.9% in 1H CY '22 (y/y)
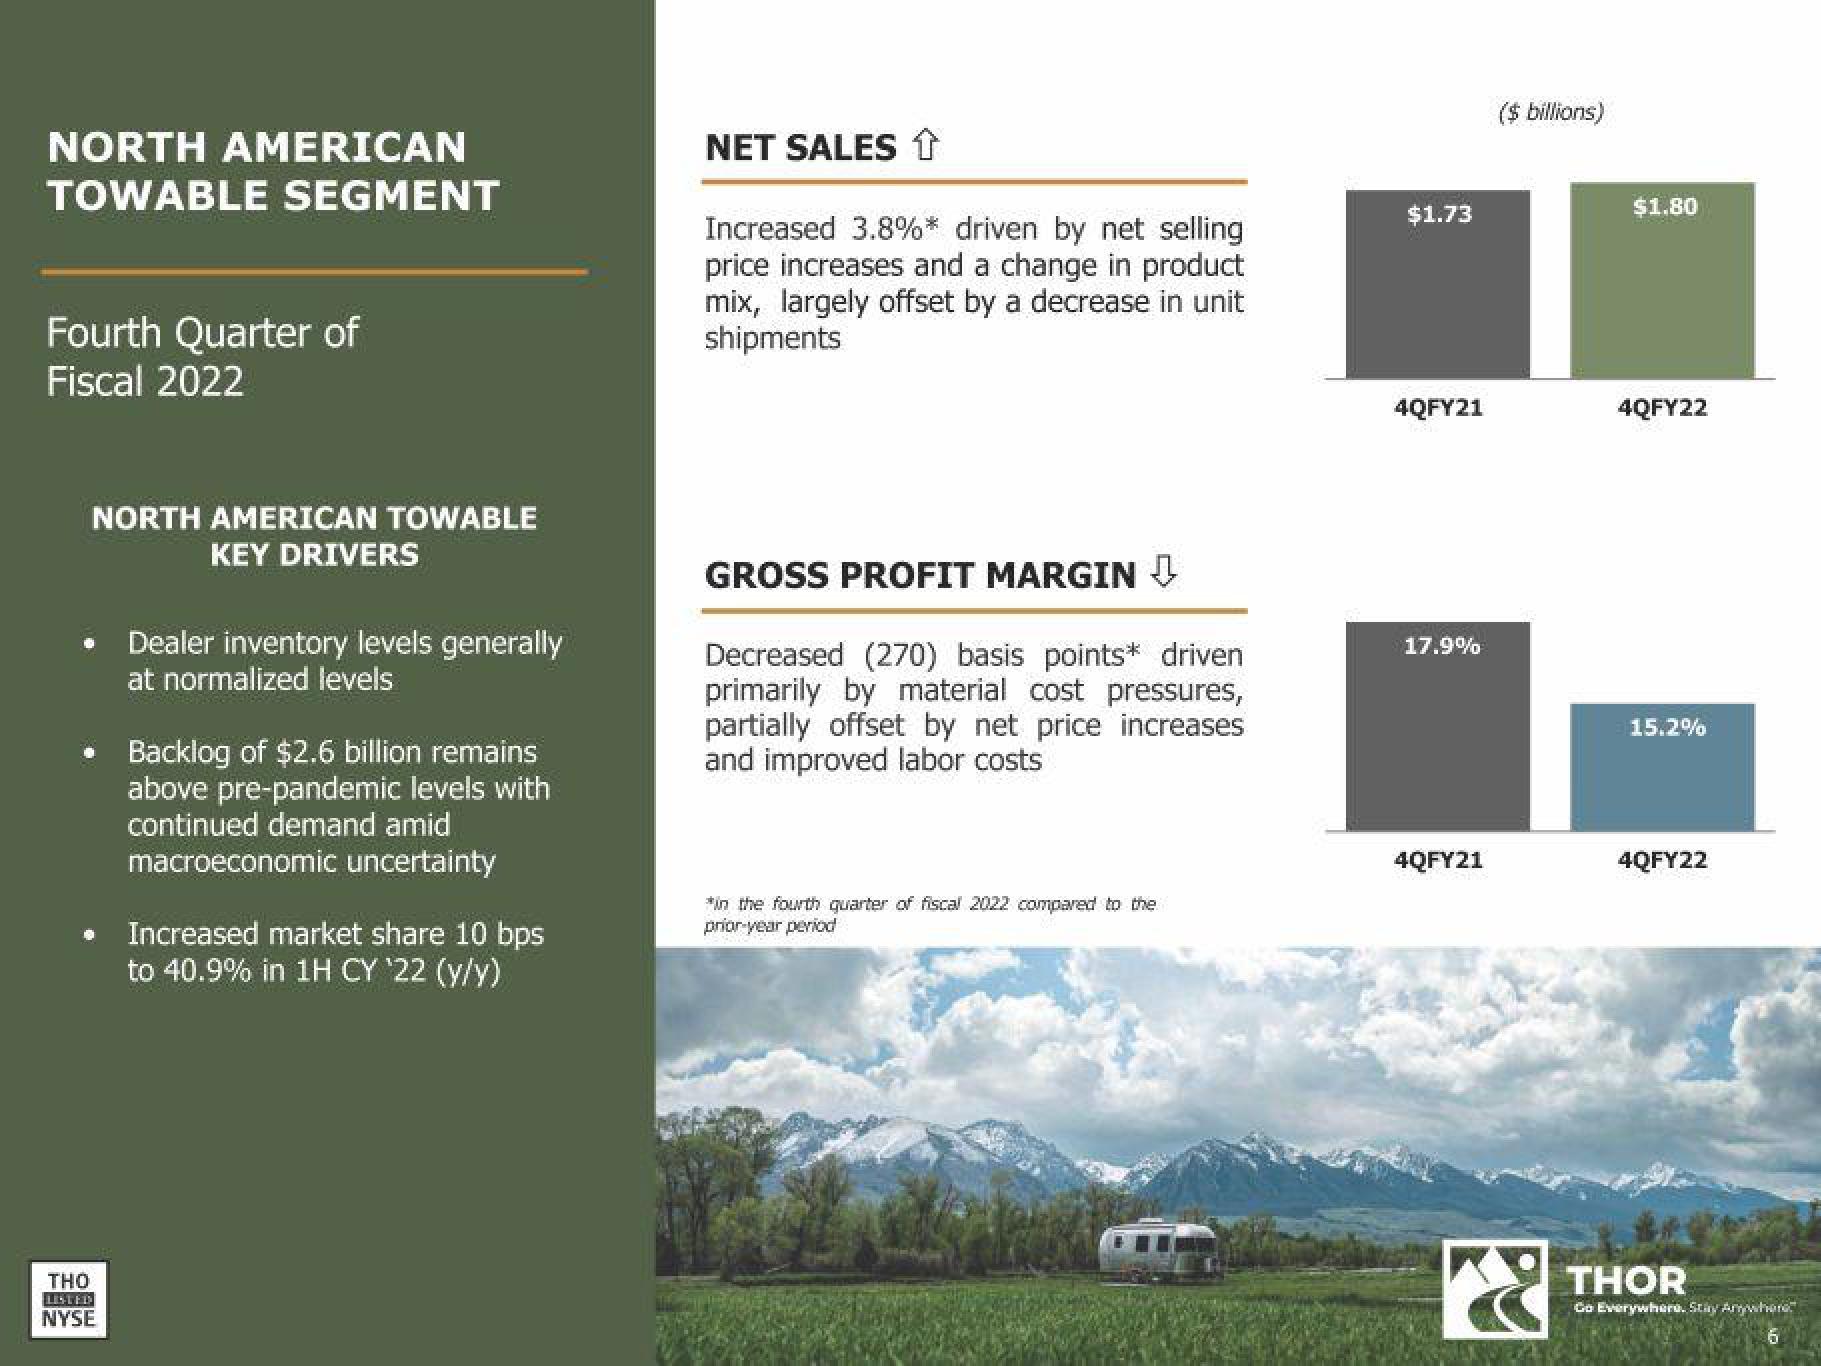
NET SALES ↑
Increased 3.8%* driven by net selling
price increases and a change in product
mix, largely offset by a decrease in unit
shipments
GROSS PROFIT MARGIN ↓
Decreased (270) basis points* driven
primarily by material cost pressures,
partially offset by net price increases
and improved labor costs
*in the fourth quarter of fiscal 2022 compared to the
prior-year period
$1.73
4QFY21
17.9%
4QFY21
($ billions)
$1.80
4QFY22
15.2%
4QFY22
THOR
Go Everywhere. Stay Anywhere
6View entire presentation