Matson Results Presentation Deck
18
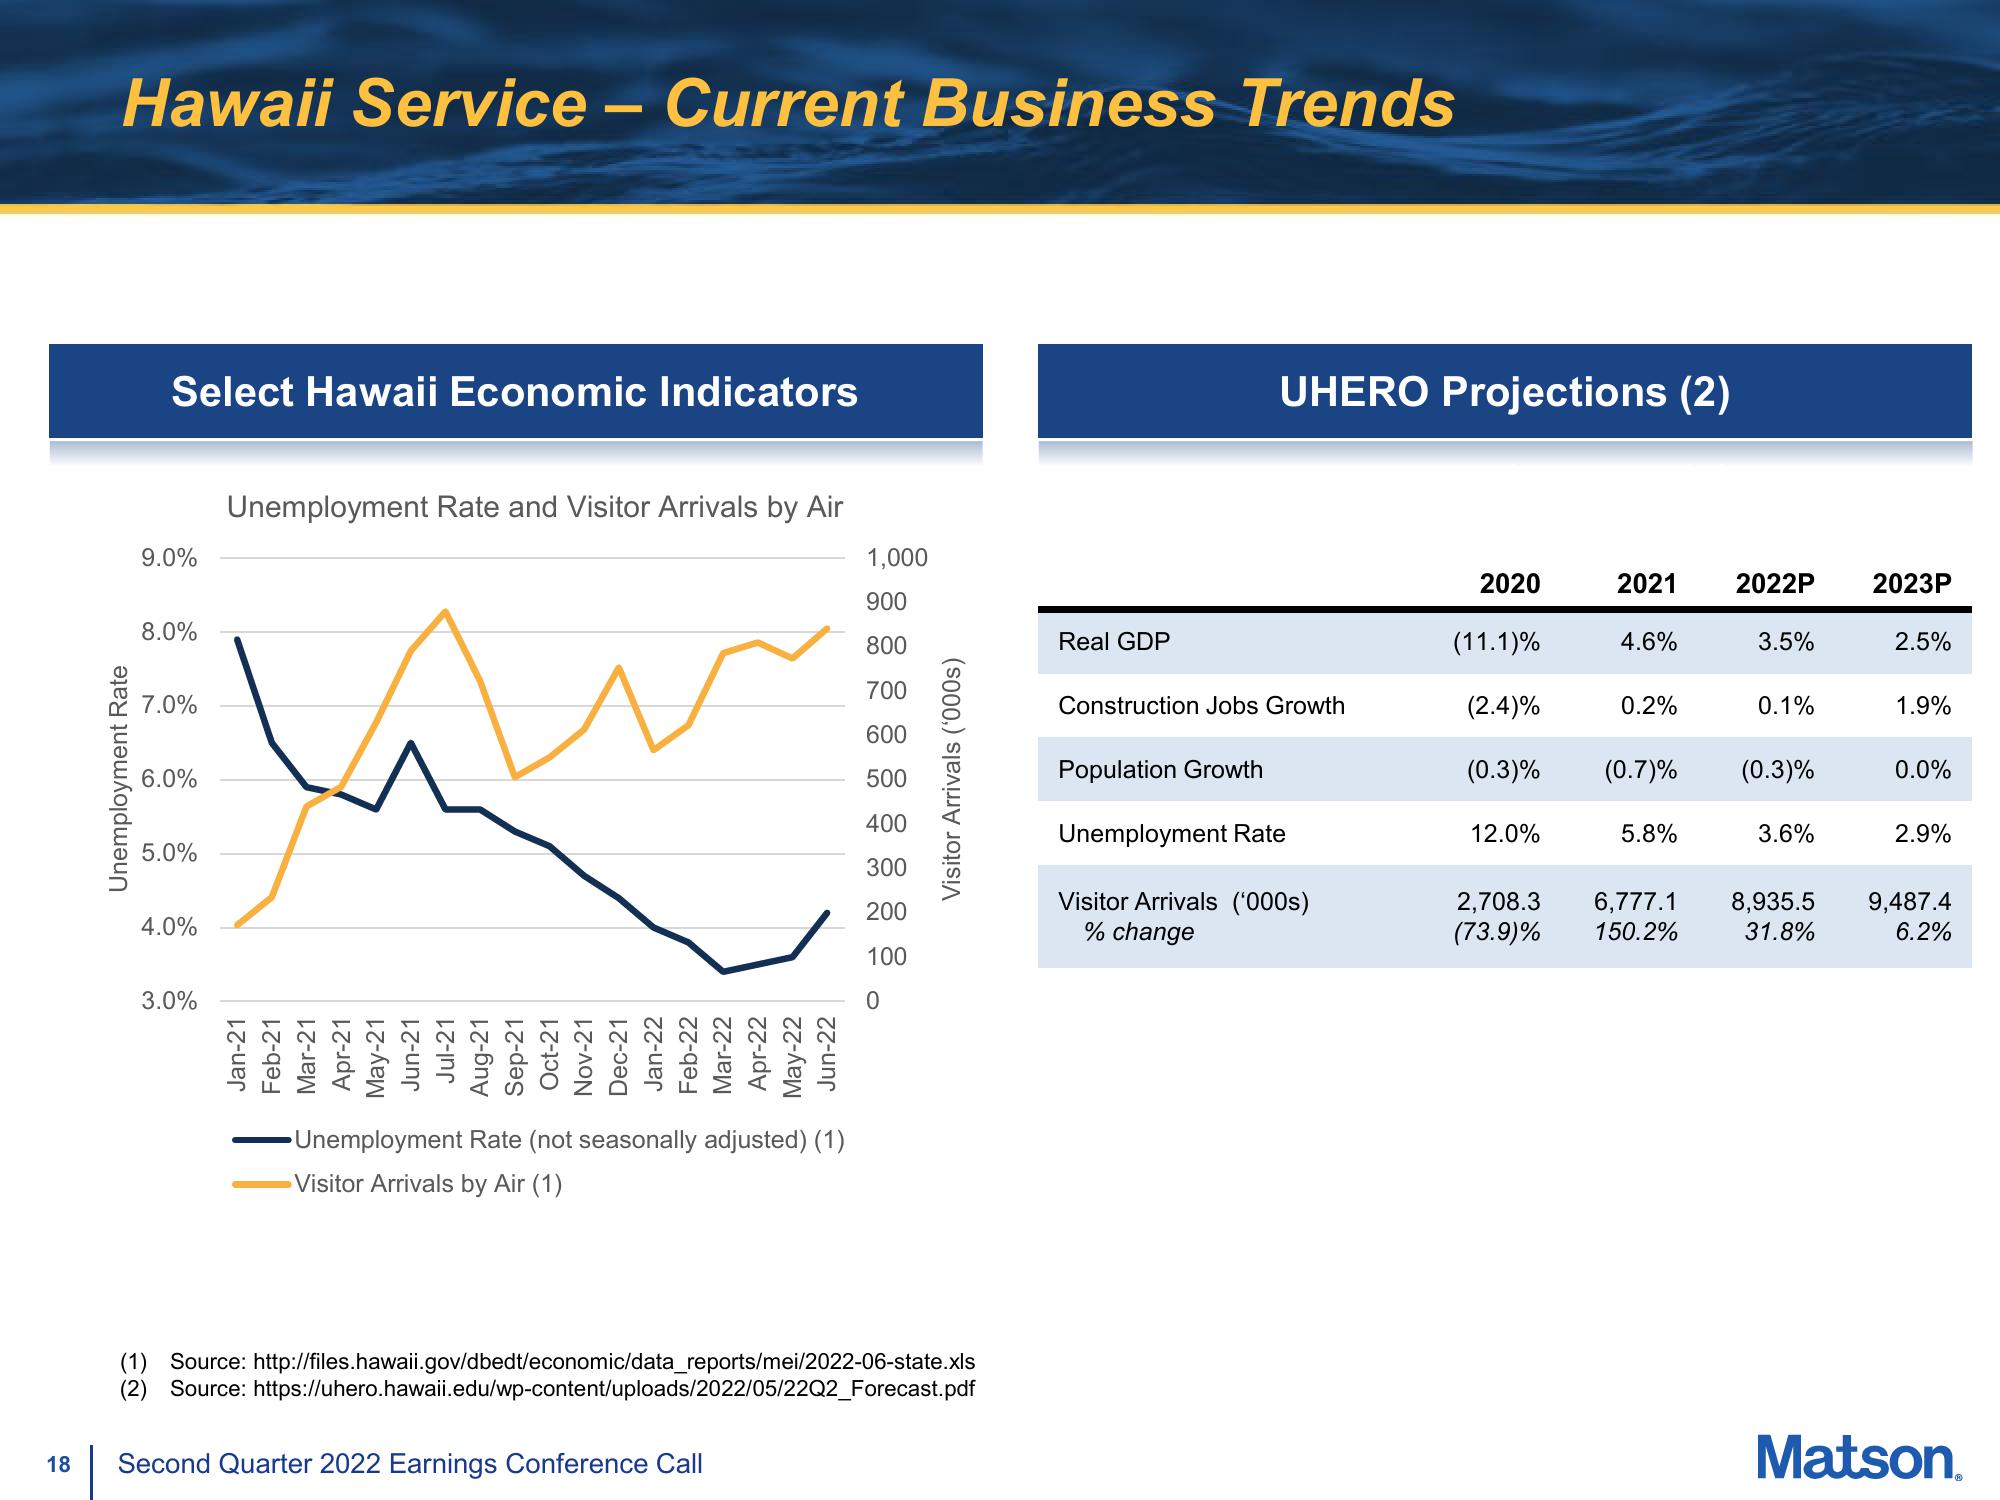
Hawaii Service - Current Business Trends
Unemployment Rate
Select Hawaii Economic Indicators
9.0%
8.0%
7.0%
6.0%
5.0%
4.0%
3.0%
Unemployment Rate and Visitor Arrivals by Air
Ww
Jan-21
Feb-21
Mar-21
Apr-21
May-21
Jun-21
Jul-21
Aug-21
Sep-21
Oct-21
Nov-21
Dec-21
Jan-22
Feb-22
Mar-22
Apr-22
May-22
Jun-22
Unemployment Rate (not seasonally adjusted) (1)
Visitor Arrivals by Air (1)
1,000
900
800
700
600
500
400
300
200
100
0
Second Quarter 2022 Earnings Conference Call
Visitor Arrivals ('000s)
(1) Source: http://files.hawaii.gov/dbedt/economic/data_reports/mei/2022-06-state.xls
(2) Source: https://uhero.hawaii.edu/wp-content/uploads/2022/05/22Q2_Forecast.pdf
Real GDP
UHERO Projections (2)
Construction Jobs Growth
Population Growth
Unemployment Rate
Visitor Arrivals ('000s)
% change
2020
(11.1)%
(2.4)%
(0.3)%
12.0%
2021 2022P
4.6%
0.2%
(0.7)%
5.8%
3.5%
0.1%
(0.3)%
3.6%
2,708.3 6,777.1 8,935.5
(73.9)% 150.2% 31.8%
2023P
2.5%
1.9%
0.0%
2.9%
9,487.4
6.2%
Matson.View entire presentation