Massachusetts Water Resources Authority (“MWRA”) Employees’ Retirement System
Baxter Street
International Long-Only
STRATEGY INCEPTION | SEPTEMBER 2012
DECEMBER 2020
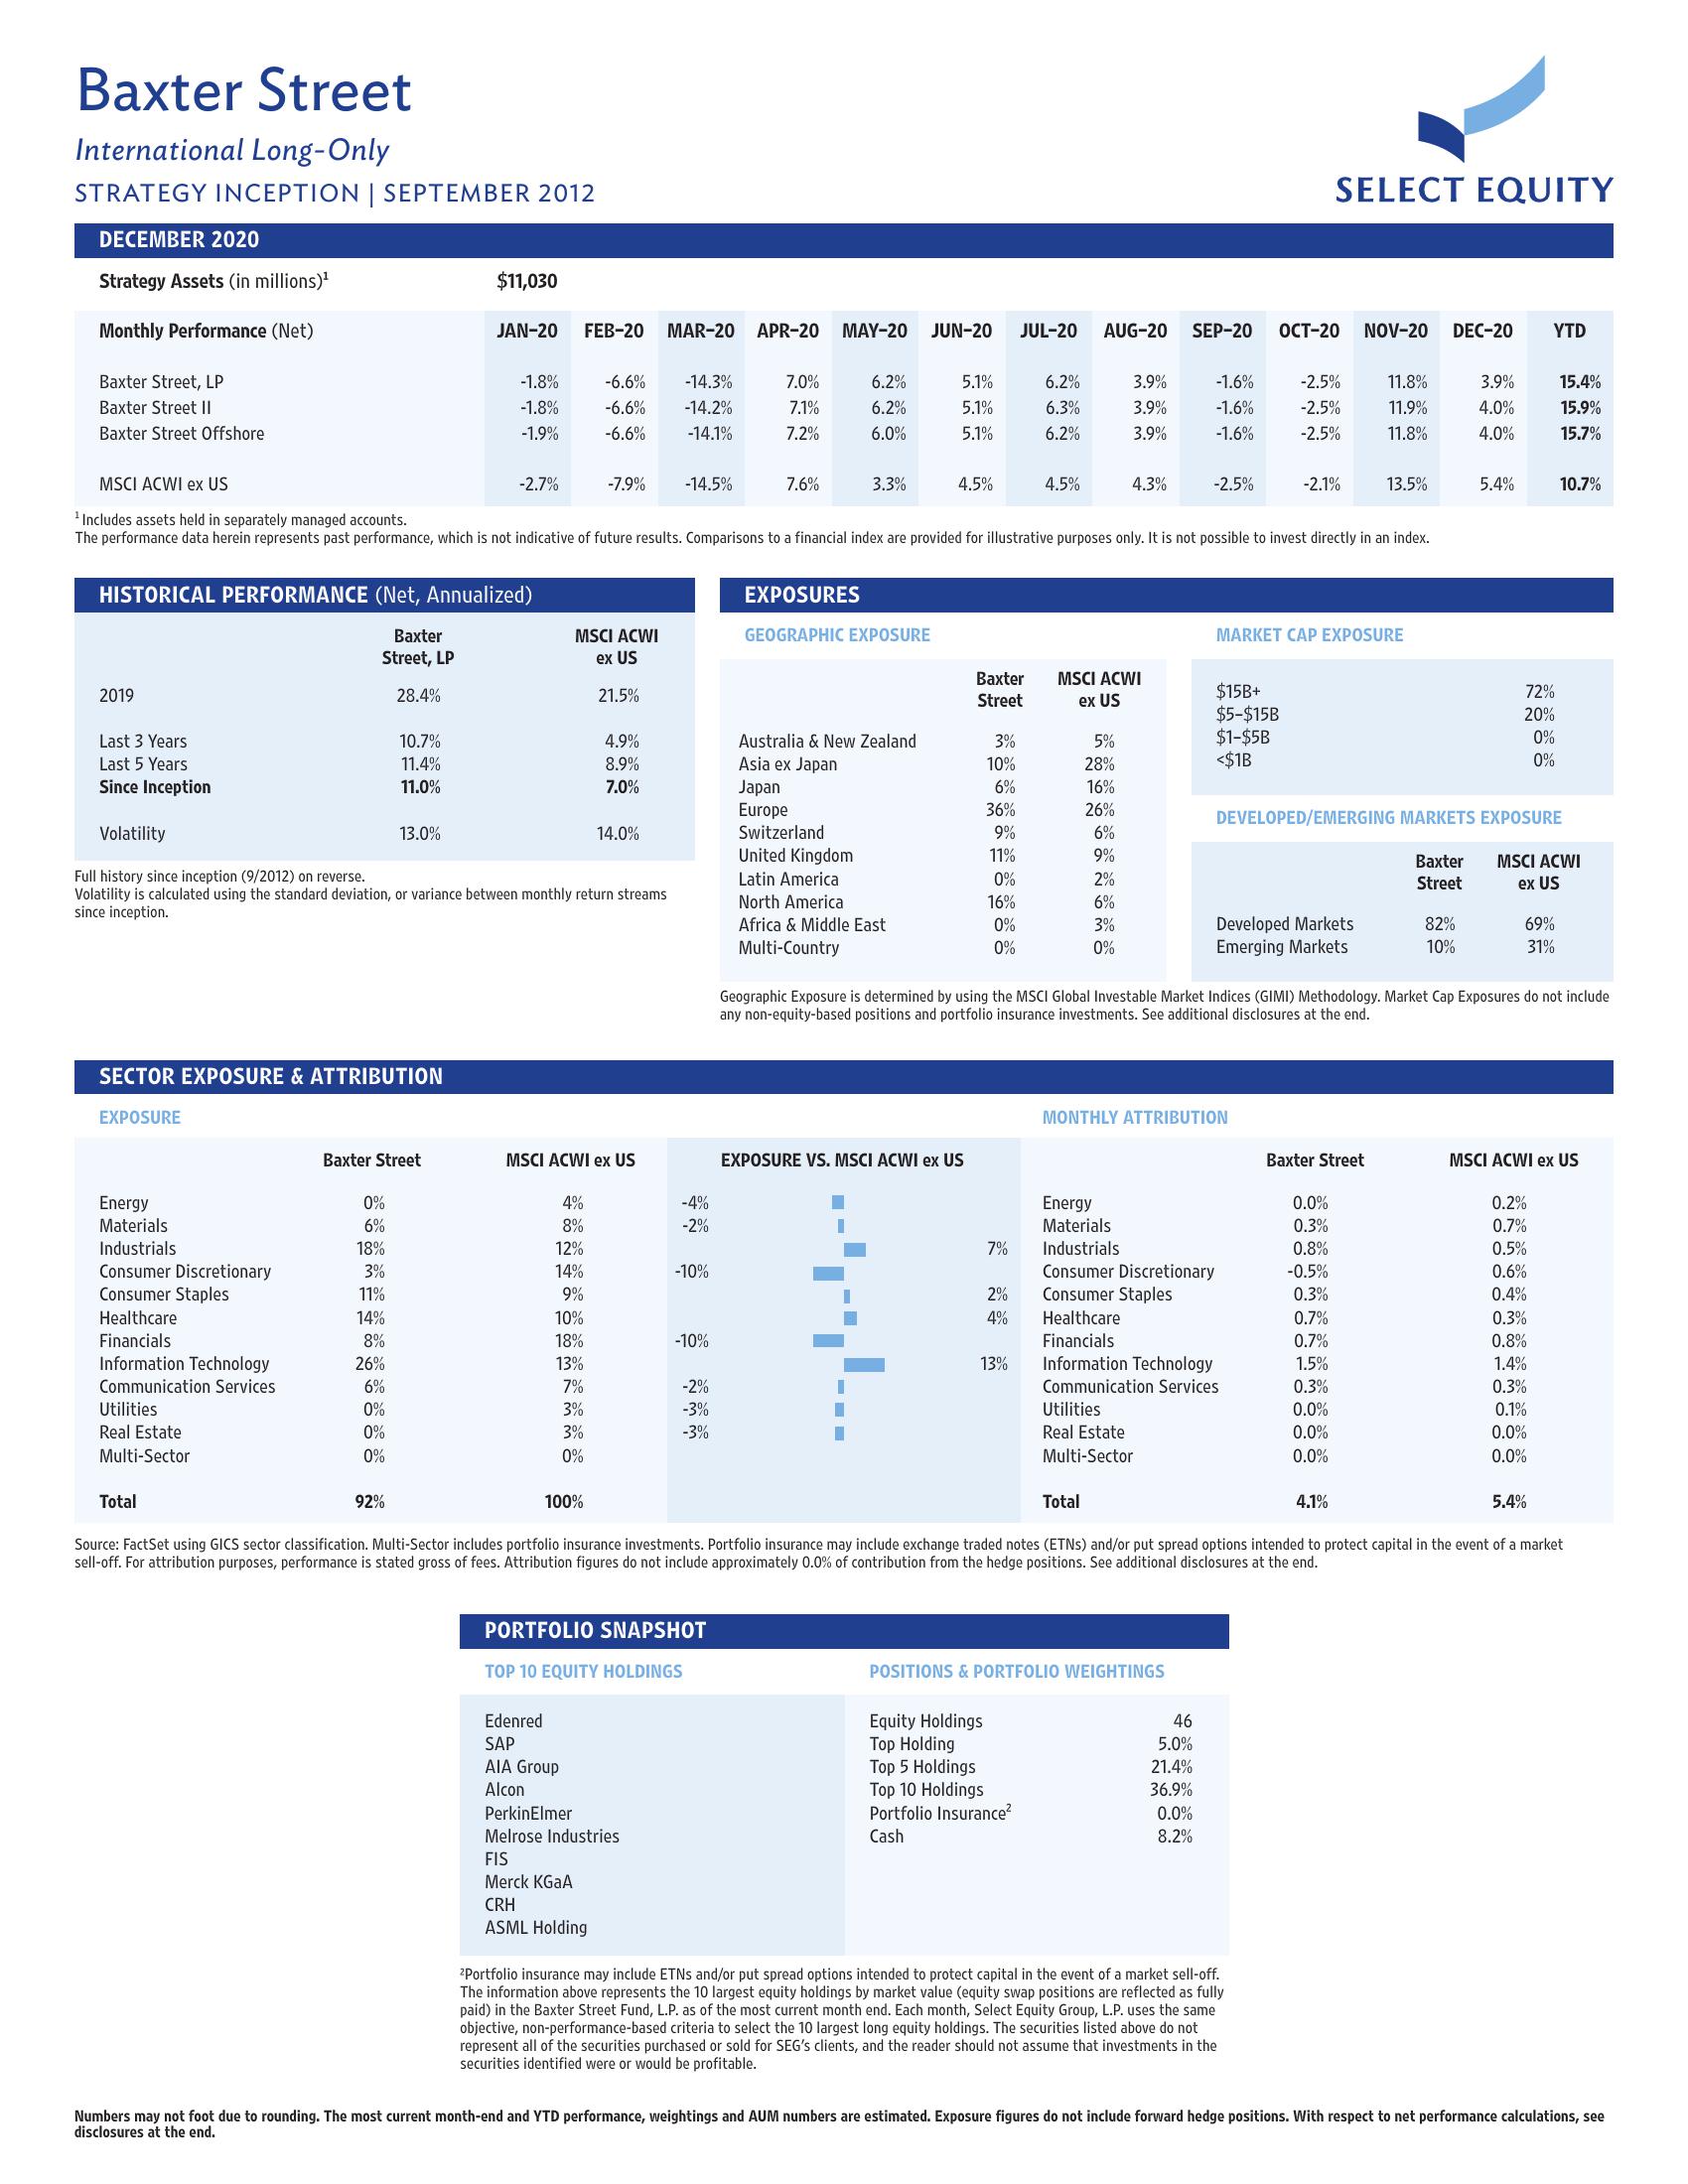
Strategy Assets (in millions)¹
Monthly Performance (Net)
Baxter Street, LP
Baxter Street II
Baxter Street Offshore
2019
Last 3 Years
Last 5 Years
Since Inception
HISTORICAL PERFORMANCE (Net, Annualized)
Baxter
Street, LP
Energy
Materials
Industrials
Consumer Discretionary
Consumer Staples
Healthcare
Financials
Information Technology
Communication Services
SECTOR EXPOSURE & ATTRIBUTION
EXPOSURE
Utilities
Real Estate
Multi-Sector
Total
28.4%
0%
6%
18%
3%
11%
10.7%
11.4%
11.0%
14%
8%
26%
6%
0%
0%
0%
13.0%
Baxter Street
92%
$11,030
JAN-20
-1.8%
-1.8%
-1.9%
Volatility
Full history since inception (9/2012) on reverse.
Volatility is calculated using the standard deviation, or variance between monthly return streams
since inception.
MSCI ACWI ex US
¹ Includes assets held in separately managed accounts.
The performance data herein represents past performance, which is not indicative of future results. Comparisons to a financial index are provided for illustrative purposes only. It is not possible to invest directly in an index.
-2.7%
FEB-20 MAR-20 APR-20
-6.6% -14.3%
-6.6% -14.2%
-6.6% -14.1%
MSCI ACWI
ex US
4%
8%
12%
14%
9%
10%
18%
13%
7%
3%
3%
0%
100%
-7.9% -14.5%
Edenred
SAP
AIA Group
Alcon
21.5%
4.9%
8.9%
7.0%
MSCI ACWI ex US
14.0%
-4%
-2%
-10%
PerkinElmer
Melrose Industries
FIS
Merck KGaA
CRH
ASML Holding
-10%
-2%
-3%
-3%
PORTFOLIO SNAPSHOT
TOP 10 EQUITY HOLDINGS
7.0%
7.1%
7.2%
MAY-20 JUN-20
7.6%
6.2%
6.2%
6.0%
3.3%
EXPOSURES
GEOGRAPHIC EXPOSURE
Australia & New Zealand
Asia ex Japan
Japan
Europe
Switzerland
5.1%
5.1%
5.1%
United Kingdom
Latin America
North America
Africa & Middle East
Multi-Country
4.5%
EXPOSURE VS. MSCI ACWI ex US
Baxter
Street
3%
10%
6%
36%
9%
11%
0%
16%
0%
0%
7%
JUL-20 AUG-20 SEP-20
2%
4%
13%
6.2%
6.3%
6.2%
4.5%
Equity Holdings
Top Holding
Top 5 Holdings
Top 10 Holdings
Portfolio Insurance²
Cash
3.9%
3.9%
3.9%
MSCI ACWI
ex US
5%
28%
16%
26%
6%
9%
2%
6%
3%
0%
4.3%
Total
-1.6%
-1.6%
-1.6%
-2.5%
POSITIONS & PORTFOLIO WEIGHTINGS
Energy
Materials
Industrials
Consumer Discretionary
Consumer Staples
Healthcare
$15B+
$5-$15B
$1-$5B
<$1B
MONTHLY ATTRIBUTION
46
5.0%
21.4%
36.9%
0.0%
8.2%
OCT-20 NOV-20 DEC-20 YTD
Financials
Information Technology
Communication Services
Utilities
Real Estate
Multi-Sector
SELECT EQUITY
-2.5%
-2.5%
-2.5%
MARKET CAP EXPOSURE
-2.1%
Developed Markets
Emerging Markets
²Portfolio insurance may include ETNs and/or put spread options intended to protect capital in the event of a market sell-off.
The information above represents the 10 largest equity holdings by market value (equity swap positions are reflected as fully
paid) in the Baxter Street Fund, L.P. as of the most current month end. Each month, Select Equity Group, L.P. uses the same
objective, non-performance-based criteria to select the 10 largest long equity holdings. The securities listed above do not
represent all of the securities purchased or sold for SEG's clients, and the reader should not assume that investments in the
securities identified were or would be profitable.
Geographic Exposure is determined by using the MSCI Global Investable Market Indices (GIMI) Methodology. Market Cap Exposures do not include
any non-equity-based positions and portfolio insurance investments. See additional disclosures at the end.
11.8%
11.9%
11.8%
Baxter Street
0.0%
0.3%
0.8%
-0.5%
0.3%
0.7%
0.7%
1.5%
0.3%
0.0%
0.0%
0.0%
13.5%
DEVELOPED/EMERGING MARKETS EXPOSURE
4.1%
Baxter
Street
3.9%
4.0%
4.0%
82%
10%
5.4%
72%
20%
0%
0%
69%
31%
MSCI ACWI
ex US
Source: FactSet using GICS sector classification. Multi-Sector includes portfolio insurance investments. Portfolio insurance may include exchange traded notes (ETNS) and/or put spread options intended to protect capital in the event of a market
sell-off. For attribution purposes, performance is stated gross of fees. Attribution figures do not include approximately 0.0% of contribution from the hedge positions. See additional disclosures at the end.
15.4%
15.9%
15.7%
10.7%
0.2%
0.7%
0.5%
0.6%
0.4%
0.3%
0.8%
1.4%
MSCI ACWI ex US
0.3%
0.1%
0.0%
0.0%
5.4%
Numbers may not foot due to rounding. The most current month-end and YTD performance, weightings and AUM numbers are estimated. Exposure figures do not include forward hedge positions. With respect to net performance calculations, see
disclosures at the end.View entire presentation