Evercore Investment Banking Pitch Book
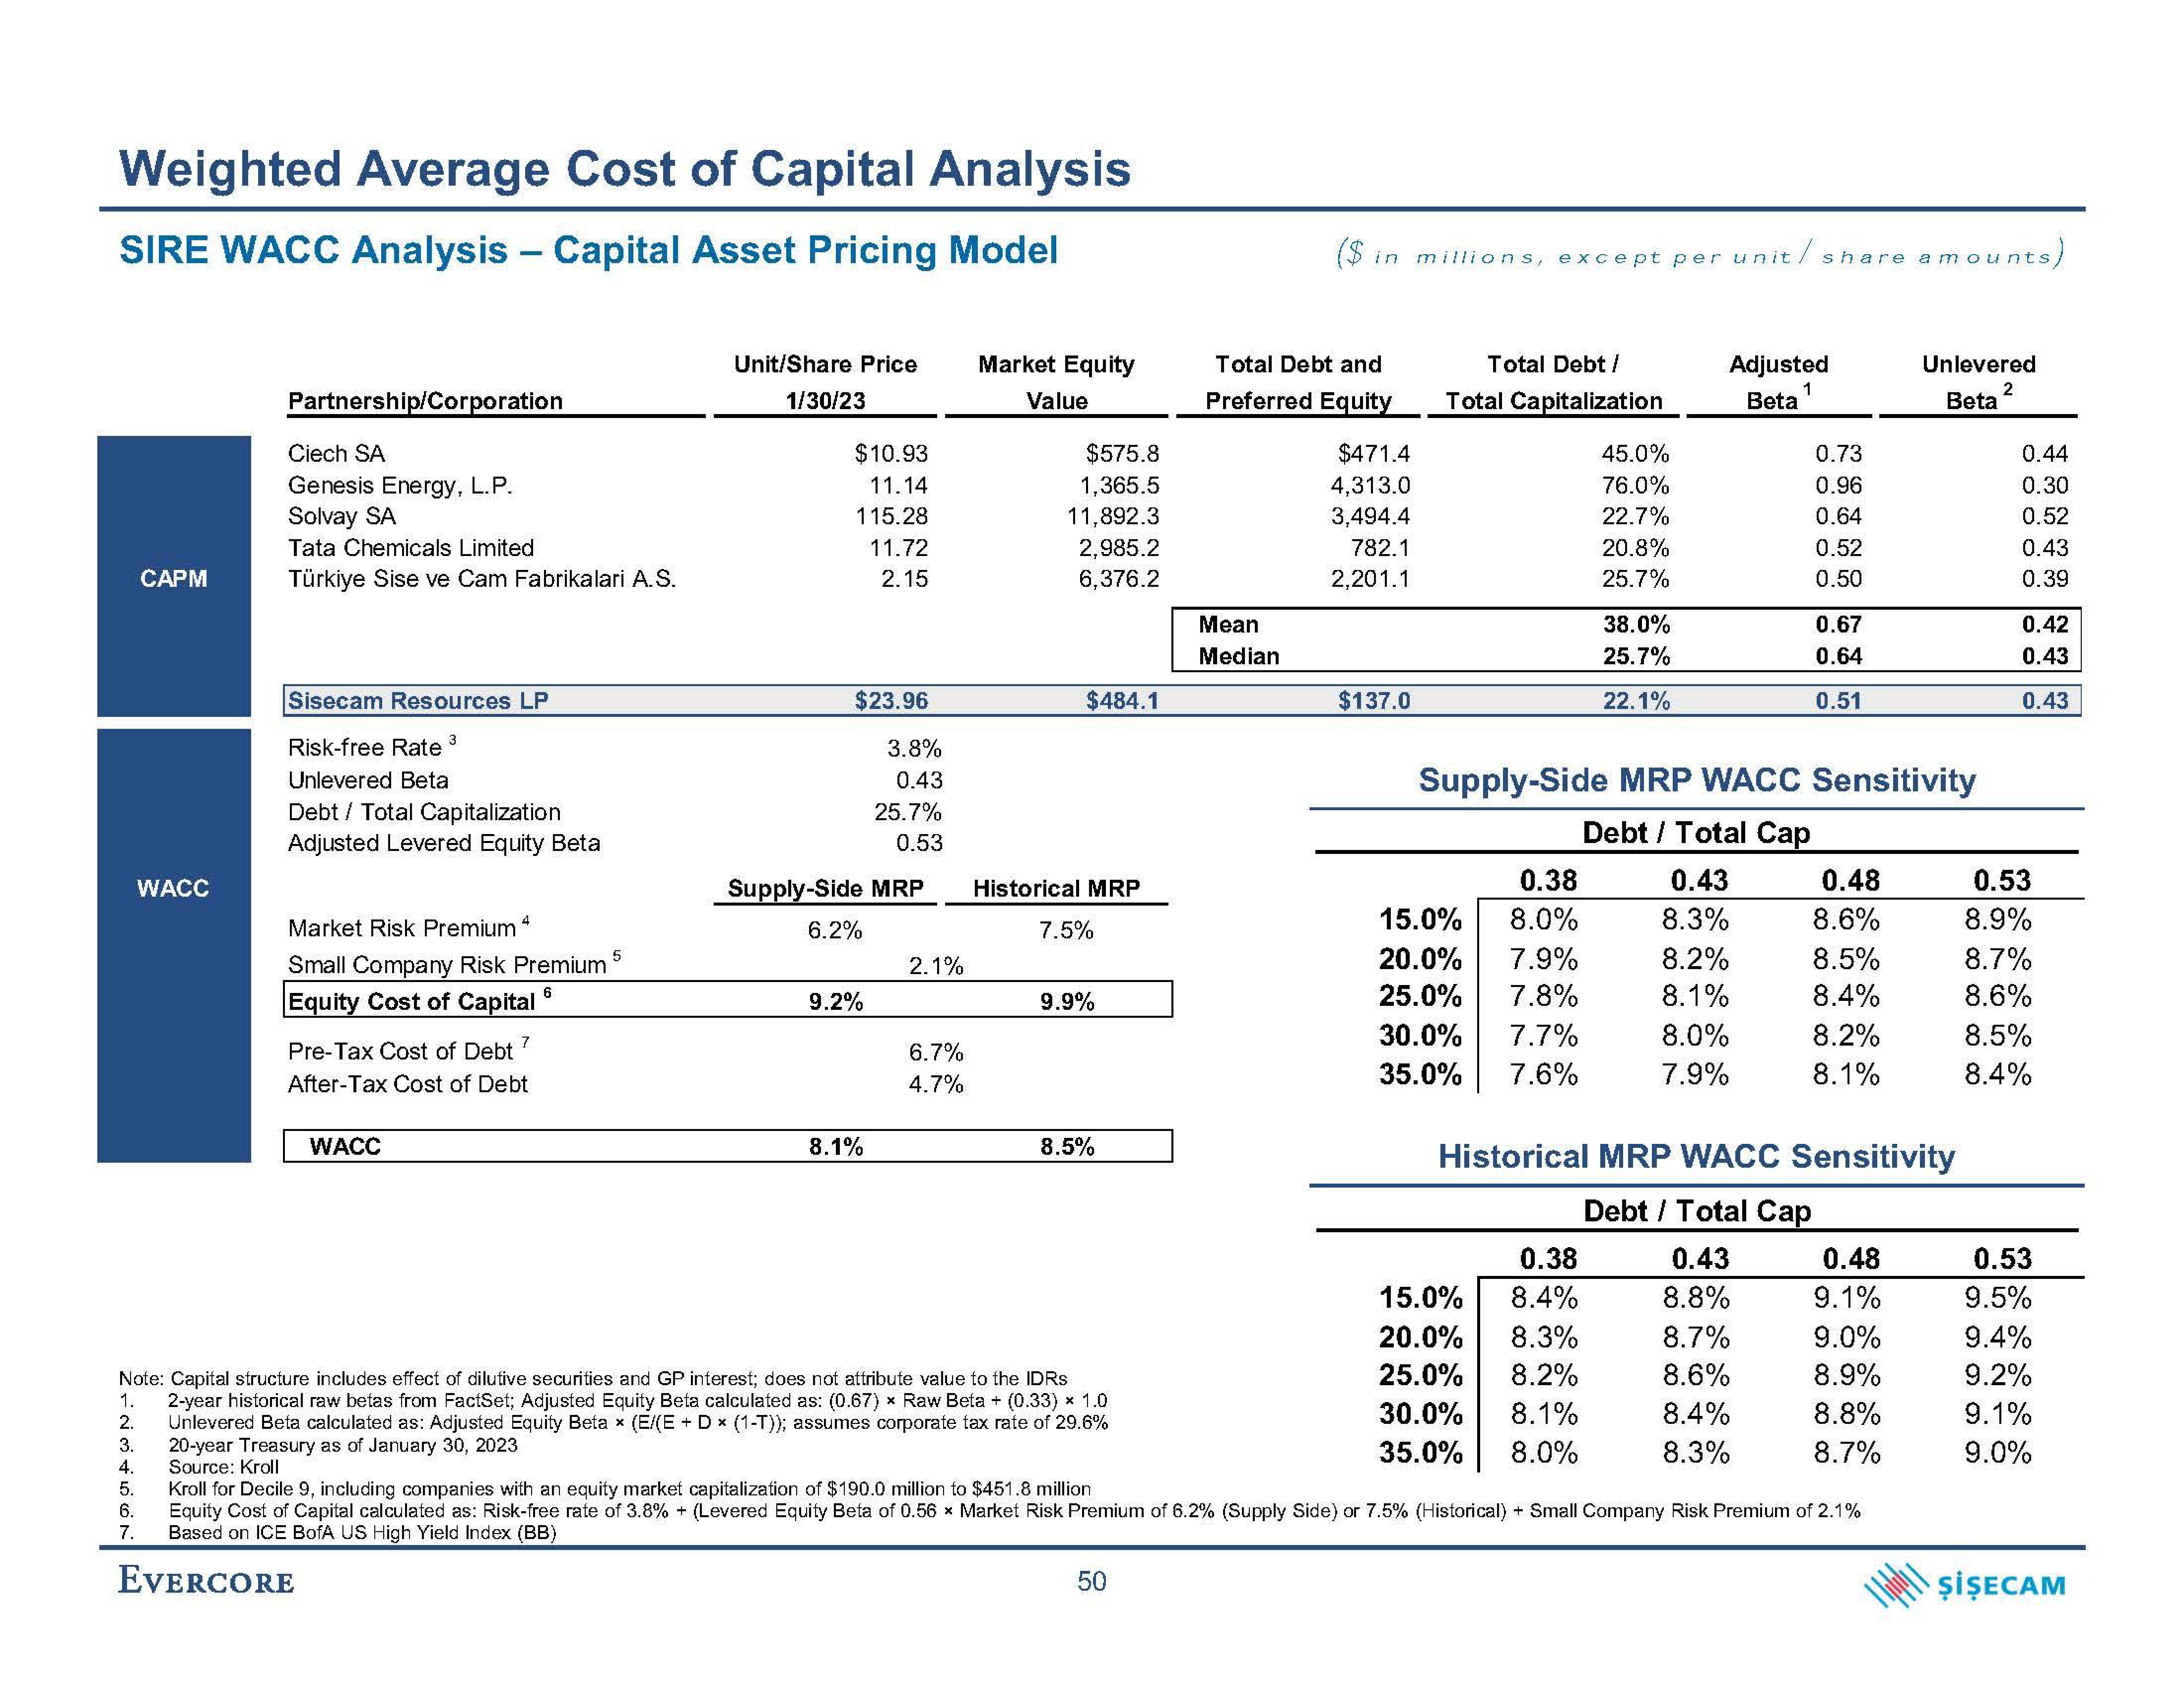
Weighted Average Cost of Capital Analysis
SIRE WACC Analysis - Capital Asset Pricing Model
CAPM
WACC
1.
2.
3.
4.
5.
6.
7.
Partnership/Corporation
Ciech SA
Genesis Energy, L.P.
Solvay SA
Tata Chemicals Limited
Türkiye Sise ve Cam Fabrikalari A.S.
Sisecam Resources LP
3
Risk-free Rate
Unlevered Beta
Debt Total Capitalization
Adjusted Levered Equity Beta
4
Market Risk Premium
Small Company Risk Premium
6
Equity Cost of Capital
Pre-Tax Cost of Debt?
After-Tax Cost of Debt
WACC
5
Unit/Share Price
1/30/23
$10.93
11.14
115.28
11.72
2.15
$23.96
Supply-Side MRP
6.2%
9.2%
3.8%
0.43
25.7%
0.53
8.1%
2.1%
6.7%
4.7%
Market Equity
Value
$575.8
1,365.5
11,892.3
2,985.2
6,376.2
$484.1
Historical MRP
7.5%
9.9%
8.5%
Note: Capital structure includes effect of dilutive securities and GP interest; does not attribute value to the IDRs
2-year historical raw betas from FactSet; Adjusted Equity Beta calculated as: (0.67) x Raw Beta + (0.33) × 1.0
Unlevered Beta calculated as: Adjusted Equity Beta x (E/(E + D x (1-T)); assumes corporate tax rate of 29.6%
20-year Treasury as of January 30, 2023
Source: Kroll
50
($ in millions, except per unit / share amounts,
Total Debt and
Preferred Equity
Mean
Median
$471.4
4,313.0
3,494.4
782.1
2,201.1
$137.0
Total Debt /
Total Capitalization
0.38
15.0%
8.0%
20.0% 7.9%
25.0% 7.8%
30.0% 7.7%
35.0% 7.6%
45.0%
76.0%
22.7%
20.8%
25.7%
38.0%
25.7%
22.1%
0.38
15.0% 8.4%
20.0% 8.3%
25.0% 8.2%
30.0% 8.1%
35.0% 8.0%
Adjusted
Beta
1
0.73
0.96
0.64
0.52
0.50
Supply-Side MRP WACC Sensitivity
Debt / Total Cap
0.43
8.3%
8.2%
8.1%
8.0%
7.9%
0.67
0.64
0.51
0.48
8.6%
8.5%
8.4%
8.2%
8.1%
Historical MRP WACC Sensitivity
Debt / Total Cap
0.43
8.8%
8.7%
8.6%
8.4%
8.3%
0.48
9.1%
Unlevered
Beta
2
9.0%
8.9%
8.8%
8.7%
Kroll for Decile 9, including companies with an equity market capitalization of $190.0 million to $451.8 million
Equity Cost of Capital calculated as: Risk-free rate of 3.8% + (Levered Equity Beta of 0.56 x Market Risk Premium of 6.2% (Supply Side) or 7.5% (Historical) + Small Company Risk Premium of 2.1%
Based on ICE BofA US High Yield Index (BB)
EVERCORE
0.44
0.30
0.52
0.43
0.39
0.42
0.43
0.43
0.53
8.9%
8.7%
8.6%
8.5%
8.4%
0.53
9.5%
9.4%
9.2%
9.1%
9.0%
ŞİŞECAMView entire presentation