Evercore Investment Banking Pitch Book
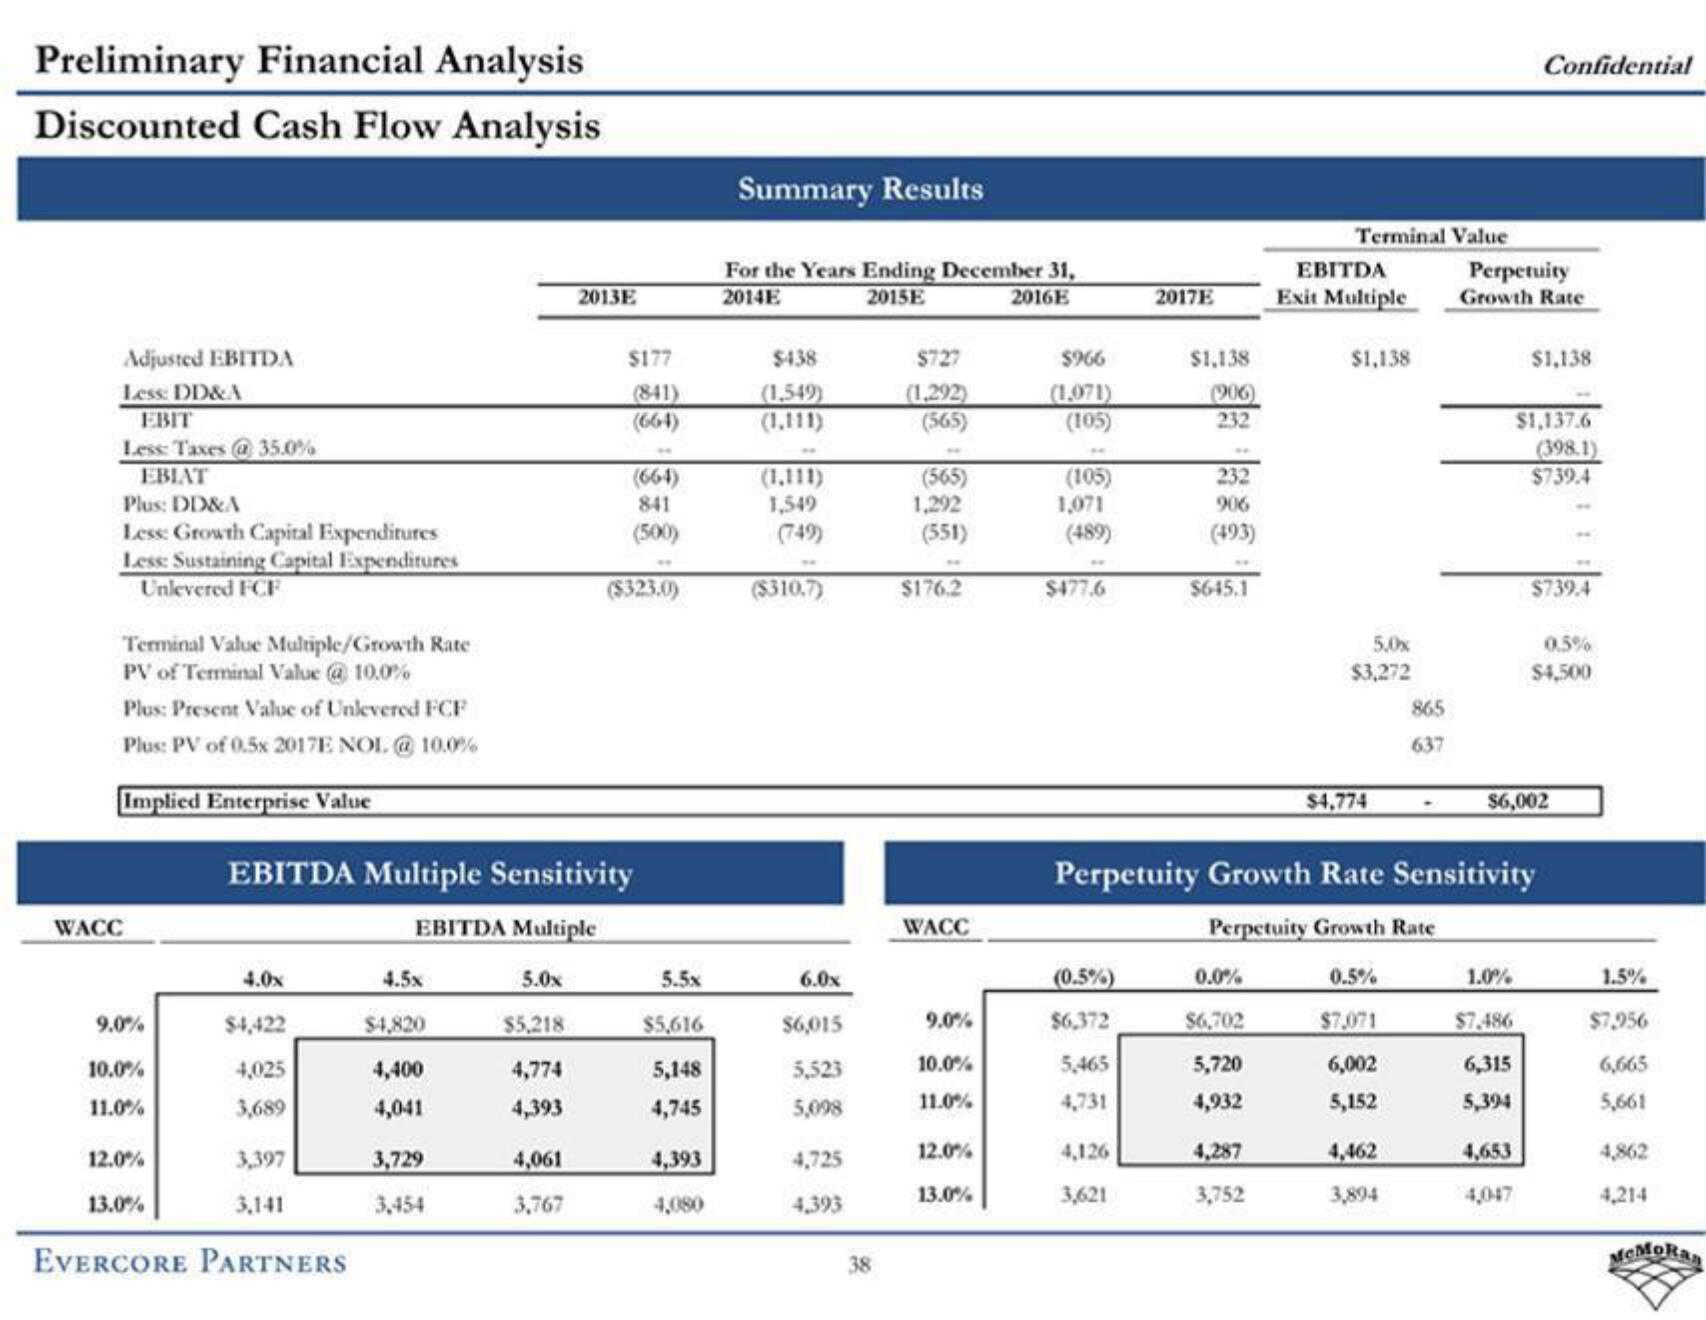
Preliminary Financial Analysis
Discounted Cash Flow Analysis
Adjusted EBITDA
Less: DD&A
EBIT
Less: Taxes @ 35.0%
EBIAT
Plus: DD&A
Less: Growth Capital Expenditures
Less: Sustaining Capital Expenditures
Unlevered FCF
Terminal Value Multiple/Growth Rate
PV of Terminal Value @ 10.0%
Plus: Present Value of Unlevered FCF
Plus: PV of 0.5x 2017E NOL @ 10.0%
Implied Enterprise Value
WACC
9.0%
10.0%
11.0%
12.0%
13.0%
4.0x
$4,422
4,025
3,689
3,397
3,141
EVERCORE PARTNERS
EBITDA Multiple Sensitivity
EBITDA Multiple
5.0x
$5,218
4,774
4,393
4.5x
$4,820
4,400
4,041
3,729
3,454
2013E
4,061
3,767
$177
(841)
(664)
(664)
841
(500)
($323.0)
5.5x
$5,616
5,148
4,745
4,393
Summary Results
For the Years Ending December 31,
2014E
2015E
2016E
$438
(1,549)
(1,111)
(1,111)
1,549
(749)
($310.7)
6.0x
$6,015
5,523
5,098
4,725
4,393
38
$727
(1,292)
(565)
(565)
1,292
(551)
$176.2
WACC
9.0%
10.0%
11.0%
12.0%
13.0%
$966
(1,071)
(105)
(105)
1,071
(489)
$477.6
(0.5%)
$6,372
5,465
4,731
2017E
4,126
3,621
$1,138
(906)
232
232
906
(493)
$645.1
0.0%
$6,702
5,720
4,932
Terminal Value
4,287
3,752
EBITDA
Exit Multiple
$1,138
5,0x
$3,272
$4,774
865
637
4,462
3,894
Perpetuity
Growth Rate
Perpetuity Growth Rate Sensitivity
Perpetuity Growth Rate
0.5%
$7,071
6,002
5,152
Confidential
1.0%
$7.486
6,315
5,394
$1,138
4,653
4,047
$1,137.6
(398.1)
$739.4
$739.4
$6,002
0.5%
$4,500
1.5%
$7,956
6,665
5,661
4,862
4,214
McMoRanView entire presentation