Wallbox SPAC Presentation Deck
CONSOLIDATED FINANCIAL SUMMARY
Wallbox future growth summary
Unit Sales
Growth
Cum. Unit Sales
Revenue
Total Revenue
Growth
COGS
Total COGS
Total Gross Profit
Total Gross Margin
OPEX
Total Opex
% of Sales
EBITDA
EBITDA Margin
CAPEX
Unlevered FCF
# (k)
%
# (k)
USD (mm)
%
USD (mm)
USD (mm)
%
USD (mm)
%
USD (mm)
%
USD (mm)
USD (mm)
2020A
35
67
24
(13)
11
45%
(21)
86%
(10)
(40%)
2021F
119
240%
186
79
230%
(48)
31
39%
(68)
86%
(37)
(47%)
(25)
(88)
2022F
232
95%
417
224
182%
(135)
89
40%
(141)
63%
(52)
(23%)
(20)
(117)
2023F
383
65%
801
463
106%
(276)
188
40%
(218)
47%
(31)
(7%)
(8)
(104)
2024F
581
52%
1,381
776
67%
(455)
321
41%
(295)
38%
26
3%
(18)
(75)
2025F
807
39%
2,188
1,173
51%
(672)
501
43%
(378)
32%
122
10%
(23)
2
Reflects non-IFRS financials | Wallbox company projections | China Joint Venture not included in the financials | Applied exchange rate: Use EUR:USD = 1.208 - 04/30/2021-ECB | Assumes
consummation of the transaction and receipt of the cash proceeds therefrom, including no redemptions | Reflects unaudited 2020 financials
2026F
1,041
29%
3,229
1,605
37%
(897)
708
44%
(460)
29%
248
15%
(50)
36
2027F
1,307
26%
4,536
2,115
32%
(1,153)
962
45%
(544)
26%
417
20%
(25)
161
COMMENTARY
●
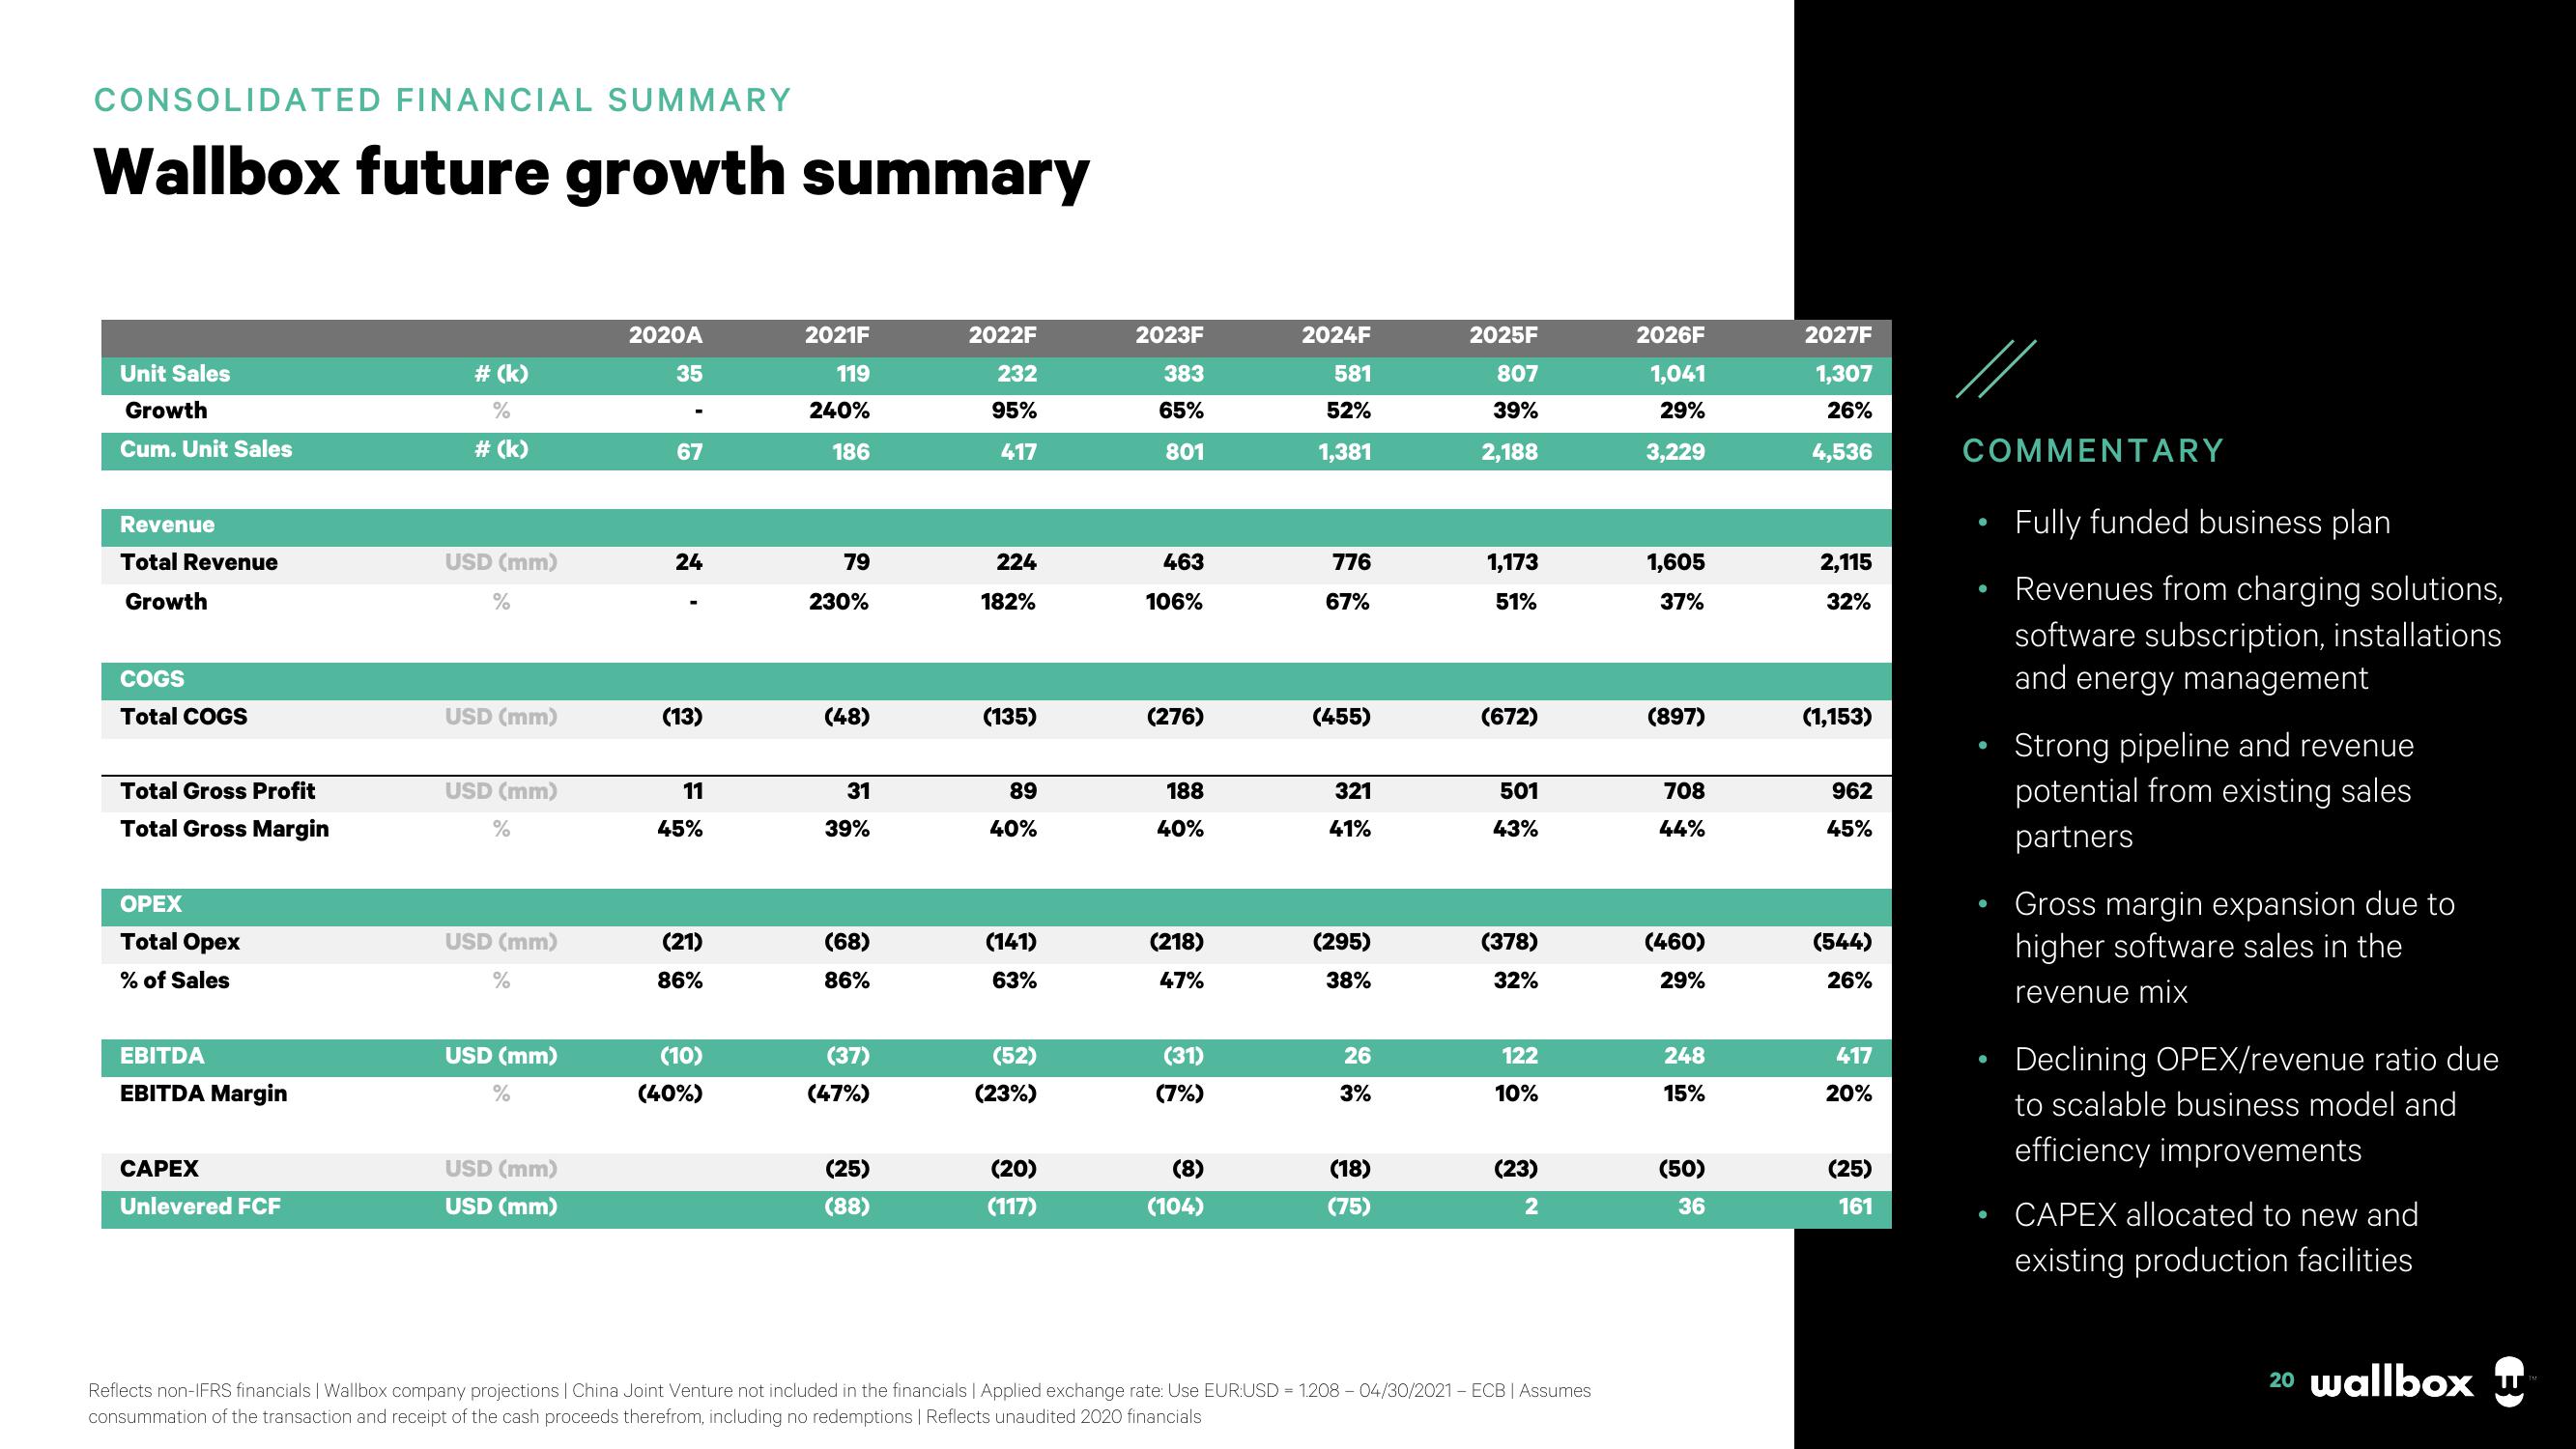
Fully funded business plan
Revenues from charging solutions,
software subscription, installations
and energy management
Strong pipeline and revenue
potential from existing sales
partners
Gross margin expansion due to
higher software sales in the
revenue mix
Declining OPEX/revenue ratio due
to scalable business model and
efficiency improvements
CAPEX allocated to new and
existing production facilities
20 wallbox wView entire presentation