TPG Results Presentation Deck
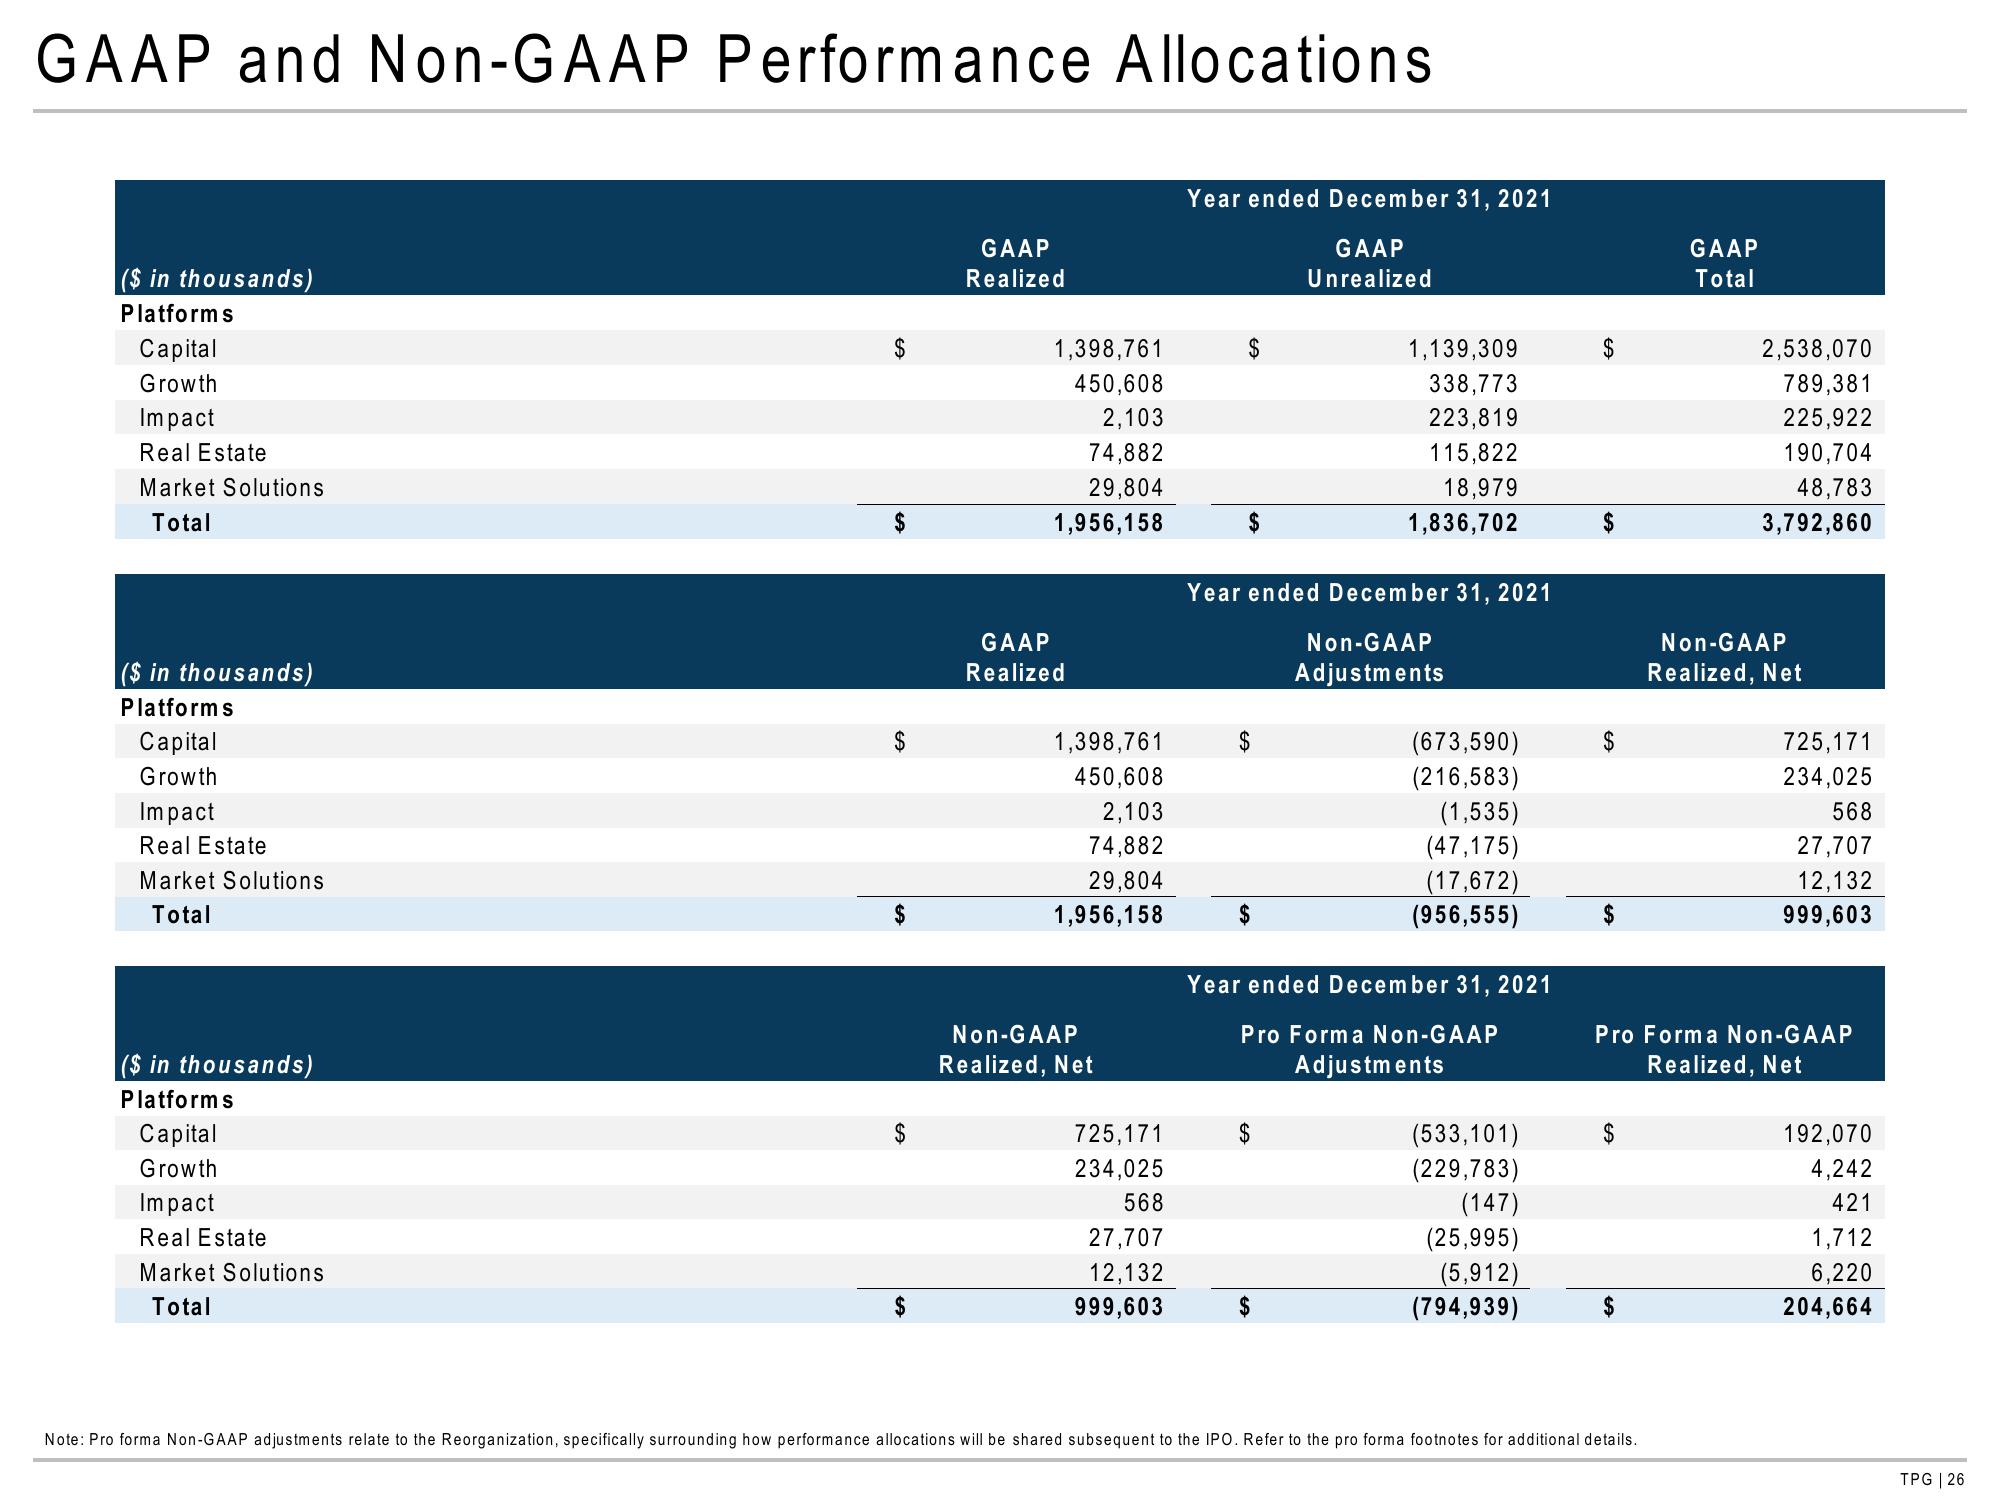
GAAP and Non-GAAP Performance Allocations
($ in thousands)
Platforms
Capital
Growth
Impact
Real Estate
Market Solutions
Total
($ in thousands)
Platforms
Capital
Growth
Impact
Real Estate
Market Solutions
Total
($ in thousands)
Platforms
Capital
Growth
Impact
Real Estate
Market Solutions
Total
$
$
$
$
$
GAAP
Realized
1,398,761
450,608
2,103
74,882
29,804
1,956,158
GAAP
Realized
1,398,761
450,608
2,103
74,882
29,804
1,956,158
Non-GAAP
Realized, Net
725,171
234,025
568
27,707
12,132
999,603
Year ended December 31, 2021
GAAP
Unrealized
$
$
Year ended December 31, 2021
Non-GAAP
Adjustments
$
1,139,309
338,773
223,819
115,822
18,979
1,836,702
$
$
(673,590)
(216,583)
Year ended December 31, 2021
Pro Forma Non-GAAP
Adjustments
(1,535)
(47,175)
(17,672)
(956,555)
(533,101)
(229,783)
(147)
(25,995)
(5,912)
(794,939)
$
$
$
GAAP
Total
Note: Pro forma Non-GAAP adjustments relate to the Reorganization, specifically surrounding how performance allocations will be shared subsequent to the IPO. Refer to the pro forma footnotes for additional details.
2,538,070
789,381
225,922
190,704
48,783
3,792,860
Non-GAAP
Realized, Net
Pro Forma Non-GAAP
Realized, Net
725,171
234,025
568
27,707
12,132
999,603
192,070
4,242
421
1,712
6,220
204,664
TPG | 26View entire presentation