Evercore Investment Banking Pitch Book
Preliminary Situation Assessment
Historical Trading Range
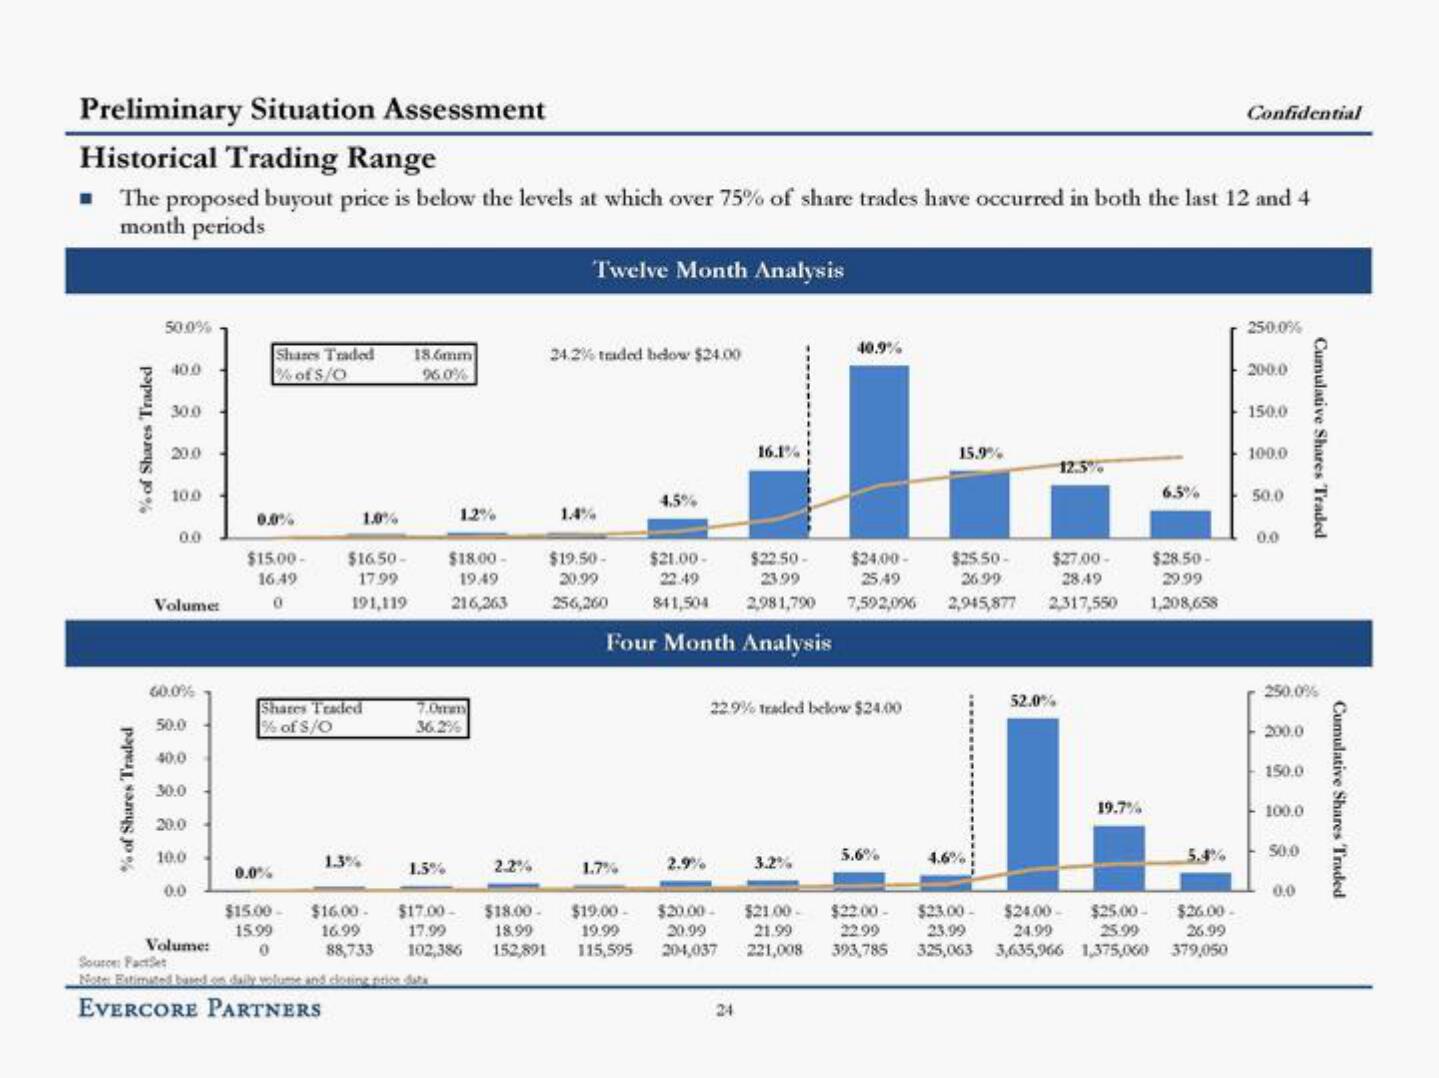
■ The proposed buyout price is below the levels at which over 75% of share trades have occurred in both the last 12 and 4
month periods
Twelve Month Analysis
% of Shares Traded
% of Shares Traded
50.0%
40.0
30.0
20.0
10.0
0.0
Volume:
60.0%
50.0
40,0
30.0
20.0
10.0
0.0
Shares Traded
% of $/0
0.0%
$15.00-
16.49
0
0.0%
Shares Traded
% of $/O
$15.00-
15.99
0
1.0%
$16.50-
17.99
191,119
1.3%
$16.00-
16.99
18.6mm
96.0%
1.5%
1.2%
7.0mm
36.2%
$18.00-
19.49
216,263
Volume:
Source: FactSet
Note Estimated based on daily volume and cloting price data
EVERCORE PARTNERS
2.2%
24.2% traded below $24.00
1.4%
$19.50-
20.99
256,260
1.7%
$17.00- $18.00-
17.99 18.99
$19.00-
19.99
88,733 102,386 152,891 115,595
4.5%
Four Month Analysis
$21.00-
22.49
$22.50-
23.99
$24.00-
25.49
841,504 2,981,790 7,592,096
2.9%
16.1%
$20.00-
20.99
204,037
22.9% traded below $24.00
24
40.9%
3.2%
5.6%
15.9%
$25.50-
$27.00-
26.99
28.49
2,945,877 2,317,550
4.6%
12.5%
52.0%
19.7%
6.5%
$28.50-
29.99
1,208,658
$21.00- $22.00-
$23.00-
$24.00- $25.00- $26.00-
21.99
22.99
23.99
24.99 25.99 26.99
221,008 393,785 325,063 3,635,966 1,375,060 379,050
Confidential
250.0%
200.0
150,0
100.0
50.0
0.0
250.0%
200.0
150.0
100.0
50,0
Cumulative Shares Traded
0.0
Cumulative Shares TradedView entire presentation