Telia Company Results Presentation Deck
TV and Media
Service revenues
Reported currency, in SEK millions, like for like growth
-
2,271
Q2 21
1,878
Q3 21
TV
+2.0%
2,594
Q4 21
2,031
Q1 22
Advertising ■ Other
2,333
Q2 22
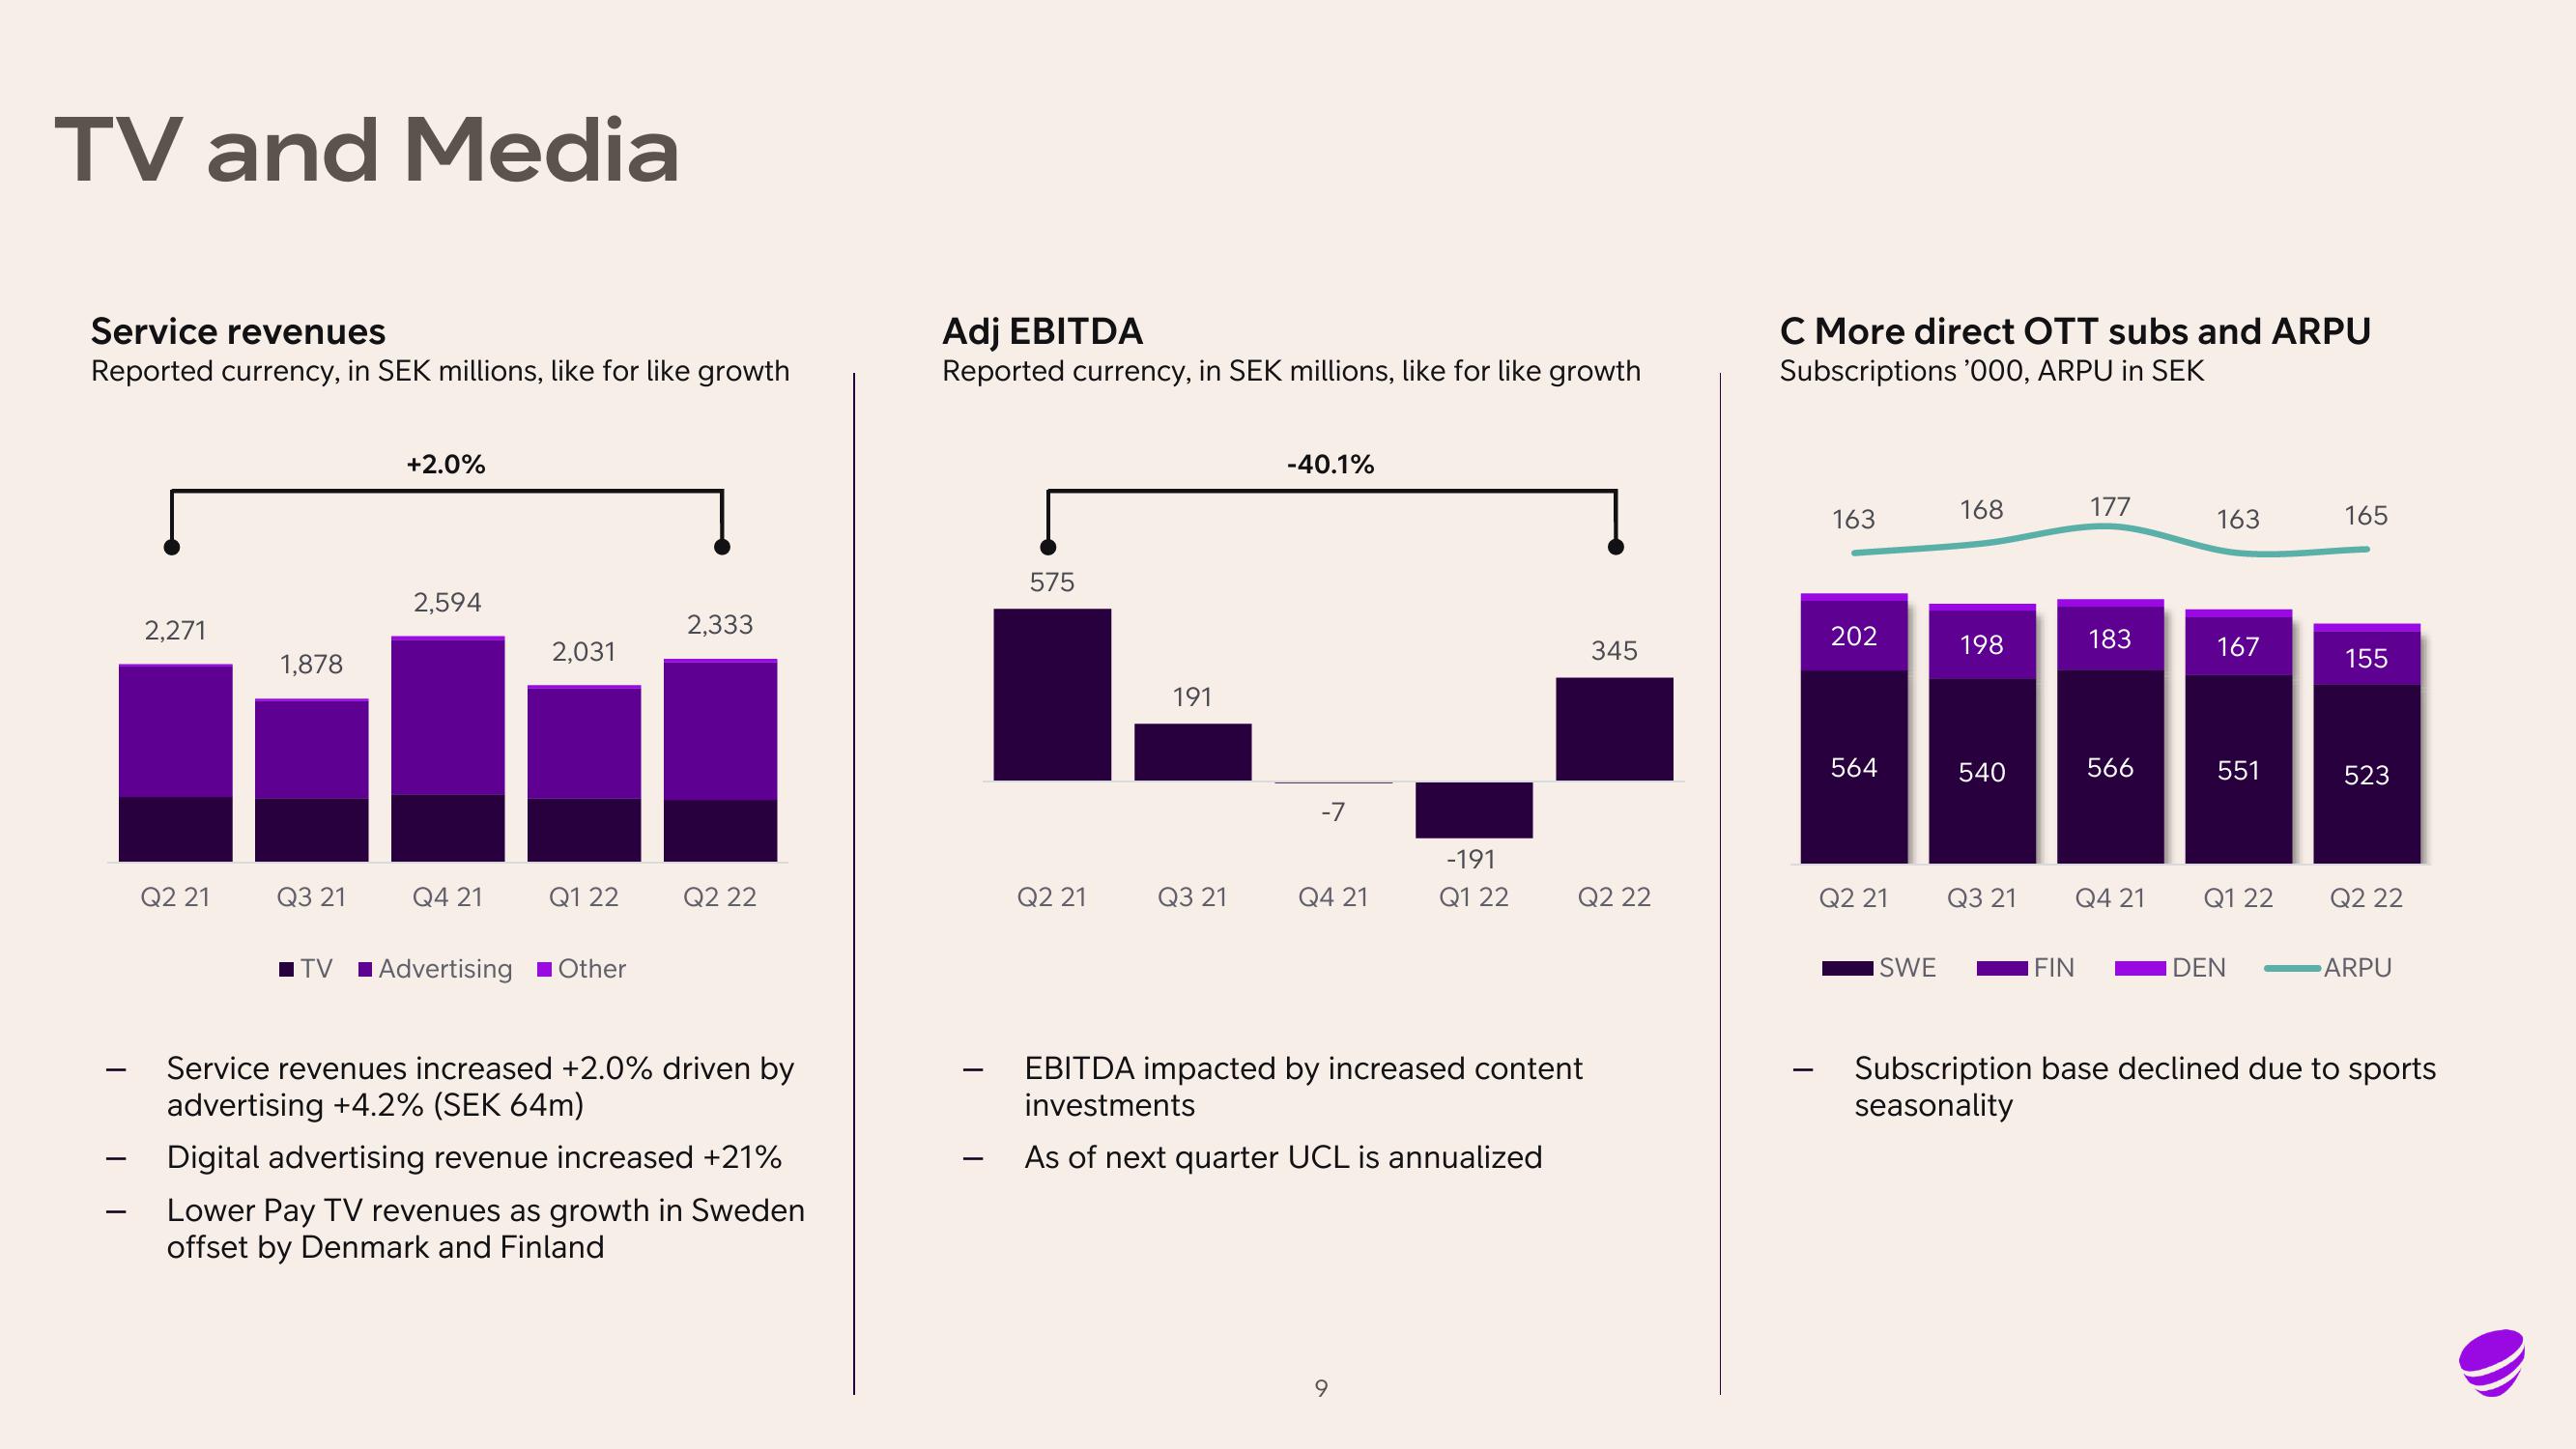
Service revenues increased +2.0% driven by
advertising +4.2% (SEK 64m)
Digital advertising revenue increased +21%
Lower Pay TV revenues as growth in Sweden
offset by Denmark and Finland
Adj EBITDA
Reported currency, in SEK millions, like for like growth
575
Q2 21
191
Q3 21
-40.1%
-7
Q4 21
-191
Q1 22
9
EBITDA impacted by increased content
investments
As of next quarter UCL is annualized
345
Q2 22
C More direct OTT subs and ARPU
Subscriptions '000, ARPU in SEK
163
202
564
Q2 21
ISWE
168
198
540
Q3 21
FIN
177
183
566
Q4 21
163
167
551
Q1 22
DEN
165
155
523
Q2 22
ARPU
Subscription base declined due to sports
seasonalityView entire presentation