Allbirds Investor Presentation Deck
INVESTOR OVERVIEW
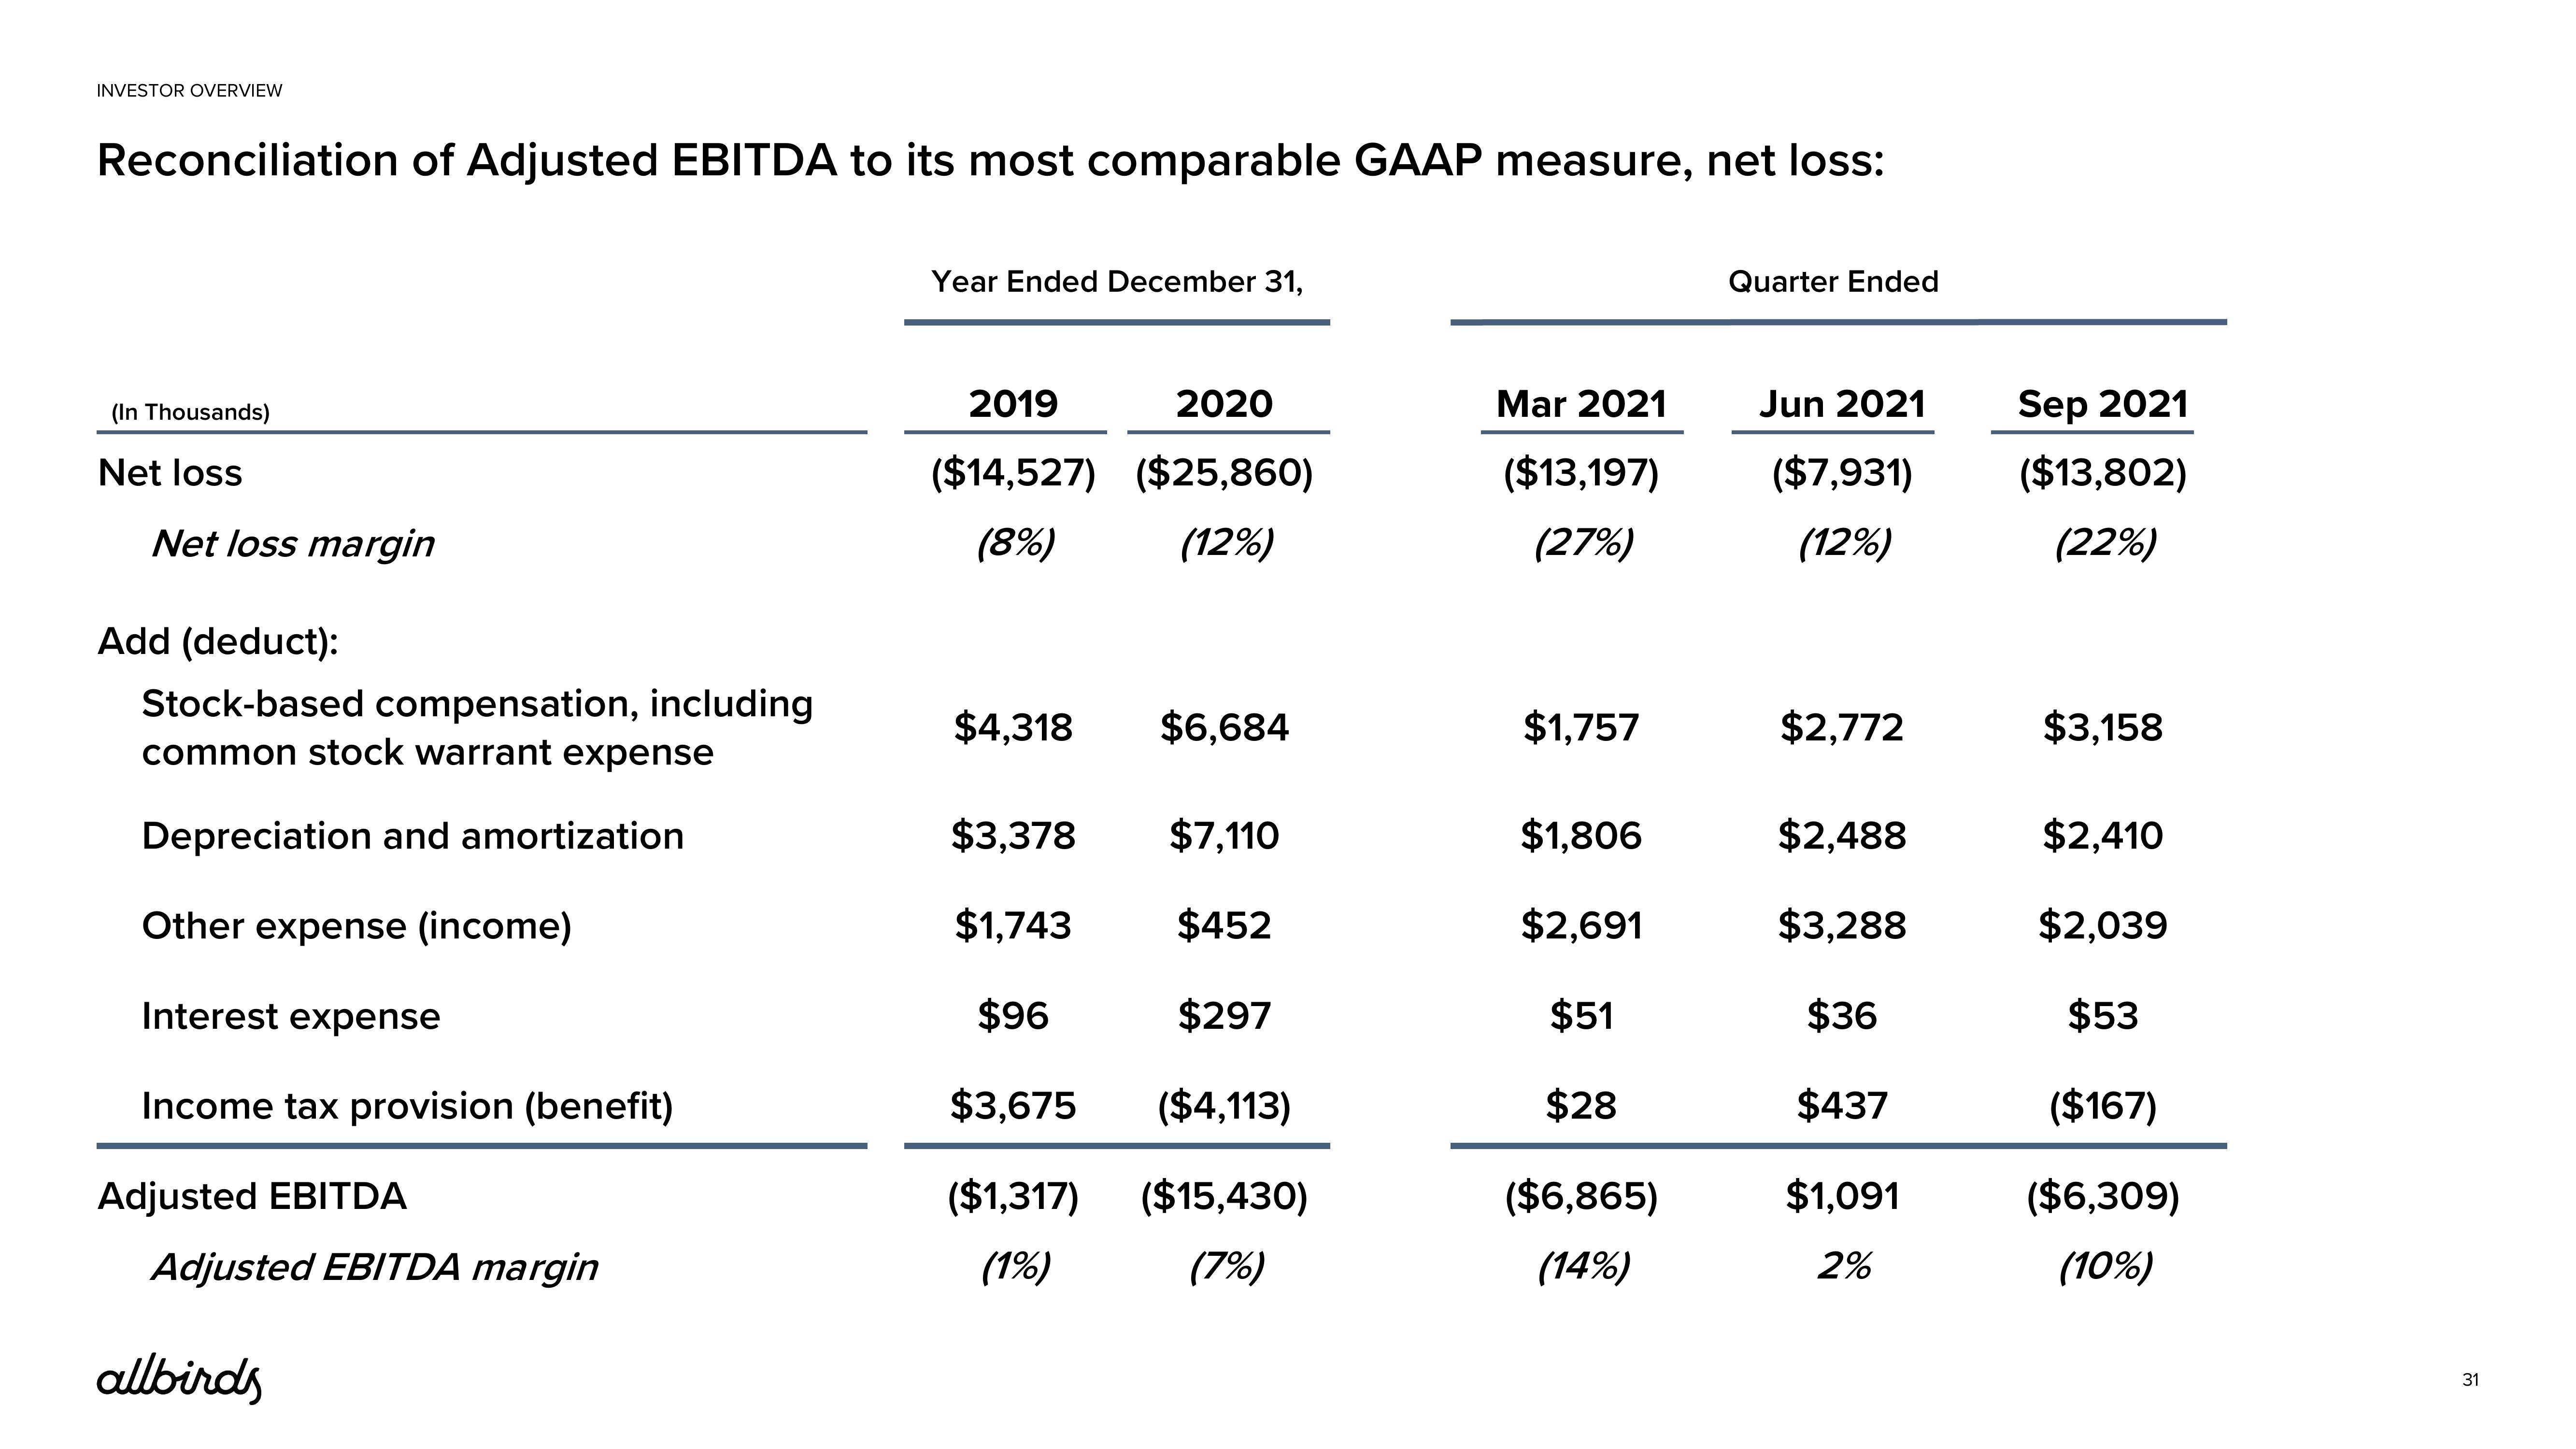
Reconciliation of Adjusted EBITDA to its most comparable GAAP measure, net loss:
(In Thousands)
Net loss
Net loss margin
Add (deduct):
Stock-based compensation, including
common stock warrant expense
Depreciation and amortization
Other expense (income)
Interest expense
Income tax provision (benefit)
Adjusted EBITDA
Adjusted EBITDA margin
allbirds
Year Ended December 31,
2019
($14,527)
(8%)
$4,318
2020
($25,860)
(12%)
$6,684
$3,378
$7,110
$1,743
$452
$96
$297
$3,675 ($4,113)
($1,317)
($15,430)
(1%)
(7%)
Mar 2021
($13,197)
(27%)
$1,757
$1,806
$2,691
$51
$28
($6,865)
(14%)
Quarter Ended
Jun 2021
($7,931)
(12%)
$2,772
$2,488
$3,288
$36
$437
$1,091
2%
Sep 2021
($13,802)
(22%)
$3,158
$2,410
$2,039
$53
($167)
($6,309)
(10%)
31View entire presentation