Main Street Capital Investor Day Presentation Deck
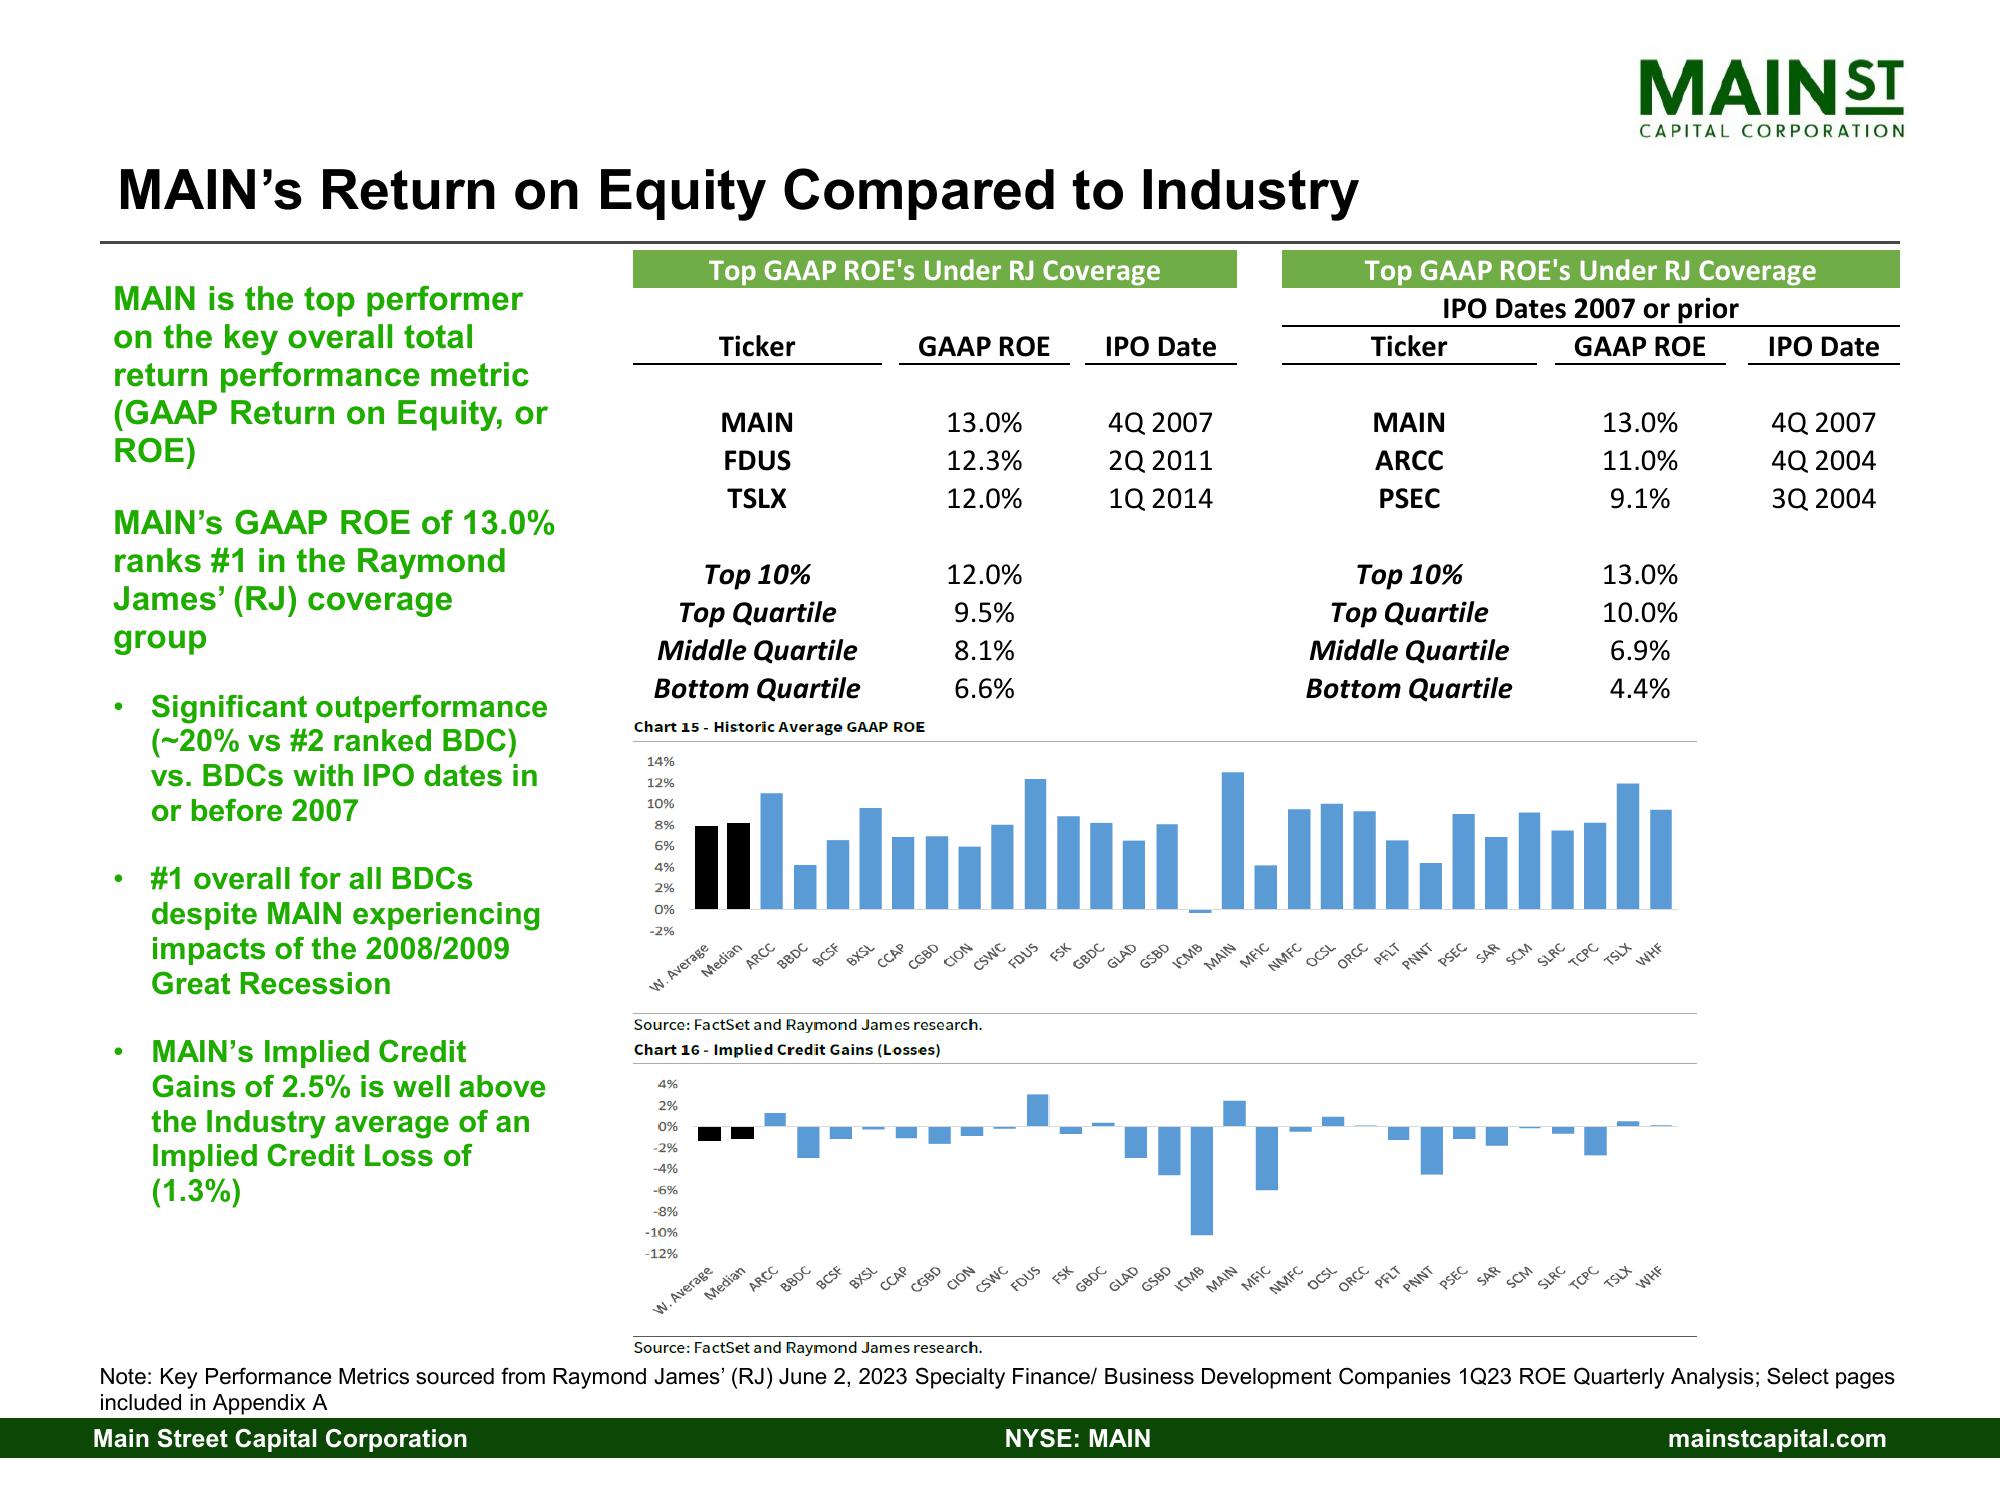
MAIN's Return on Equity Compared to Industry
Top GAAP ROE's Under RJ Coverage
MAIN is the top performer
on the key overall total
return performance metric
(GAAP Return on Equity, or
ROE)
MAIN'S GAAP ROE of 13.0%
ranks #1 in the Raymond
James' (RJ) coverage
group
●
●
Significant outperformance
(-20% vs #2 ranked BDC)
vs. BDCs with IPO dates in
or before 2007
#1 overall for all BDCs
despite MAIN experiencing
impacts of the 2008/2009
Great Recession
MAIN's Implied Credit
Gains of 2.5% is well above
the Industry average of an
Implied Credit Loss of
(1.3%)
14%
12%
10%
8%
6%
4%
2%
0%
-2%
Ticker
Top 10%
Top Quartile
Middle Quartile
Bottom Quartile
Chart 15 - Historic Average GAAP ROE
4%
2%
10%
MAIN
FDUS
TSLX
W. Average
-2%
-4%
-16%
-8%
-10%
-12%
Median
ARCC
BBDC
W. Average
Median
BCSF
ARCC
BBDC
BXSL
BCSF
............... ..............
LI
Im dali
Source: FactSet and Raymond James research.
Chart 16 - Implied Credit Gains (Losses)
GAAP ROE
CCAP
BXSL
CGBD
CCAP
13.0%
12.3%
12.0%
12.0%
9.5%
8.1%
6.6%
CION
CGBD
CSWC
CION
FDUS
FDUS
CSWC
FSK
IPO Date
4Q 2007
2Q 2011
1Q 2014
FSK
GBDC
GBDC
GLAD
GSBD
S
ICMB
GLAD
MAIN
ICMB
GSBD
MFIC
MFIC
MAIN
Top 10%
Top Quartile
Middle Quartile
Bottom Quartile
OCSL
NMFC
OCSL
NMFC
Top GAAP ROE's Under RJ Coverage
IPO Dates 2007 or prior
Ticker
GAAP ROE
ORCC
MAIN
ARCC
PSEC
PELT
ORCC
PNNT
PFLT
PSEC
PSEC
PNNT
SAR
SAR
SCM
SCM
SLRC
TCPC
SLRC
TCPC
MAINST
CAPITAL CORPORATION
13.0%
11.0%
9.1%
13.0%
10.0%
6.9%
4.4%
TSLX
TSLX
WHF
WHF
IPO Date
4Q 2007
4Q 2004
3Q 2004
Source: FactSet and Raymond James research.
Note: Key Performance Metrics sourced from Raymond James' (RJ) June 2, 2023 Specialty Finance/ Business Development Companies 1Q23 ROE Quarterly Analysis; Select pages
included in Appendix A
Main Street Capital Corporation
NYSE: MAIN
mainstcapital.comView entire presentation