Ginkgo Results Presentation Deck
Q2 2022 Financial Summary (Unaudited)
In millions of USD
except new programs and % YoY
New programs launched
Revenue:
Foundry
Biosecurity
Total revenue
Biosecurity cost of sales
Research and development (excl. SBC)
General and administrative (excl. SBC)
Total operating expenses (excl. SBC)
(1)
Stock-based compensation
Loss from operations
Net loss
Adjusted EBITDA
Capital expenditures
Three Months Ended June 30,
2022
13
$44
100
145
64
72
48
184
607
(647)
(671)
(23)
10
2021
7
$22
22
44
17
52
20
89
15
(60)
(54)
(38)
24
% YOY
86%
105%
355%
231%
274%
38%
143%
107%
NM
NM
NM
38%
(60%)
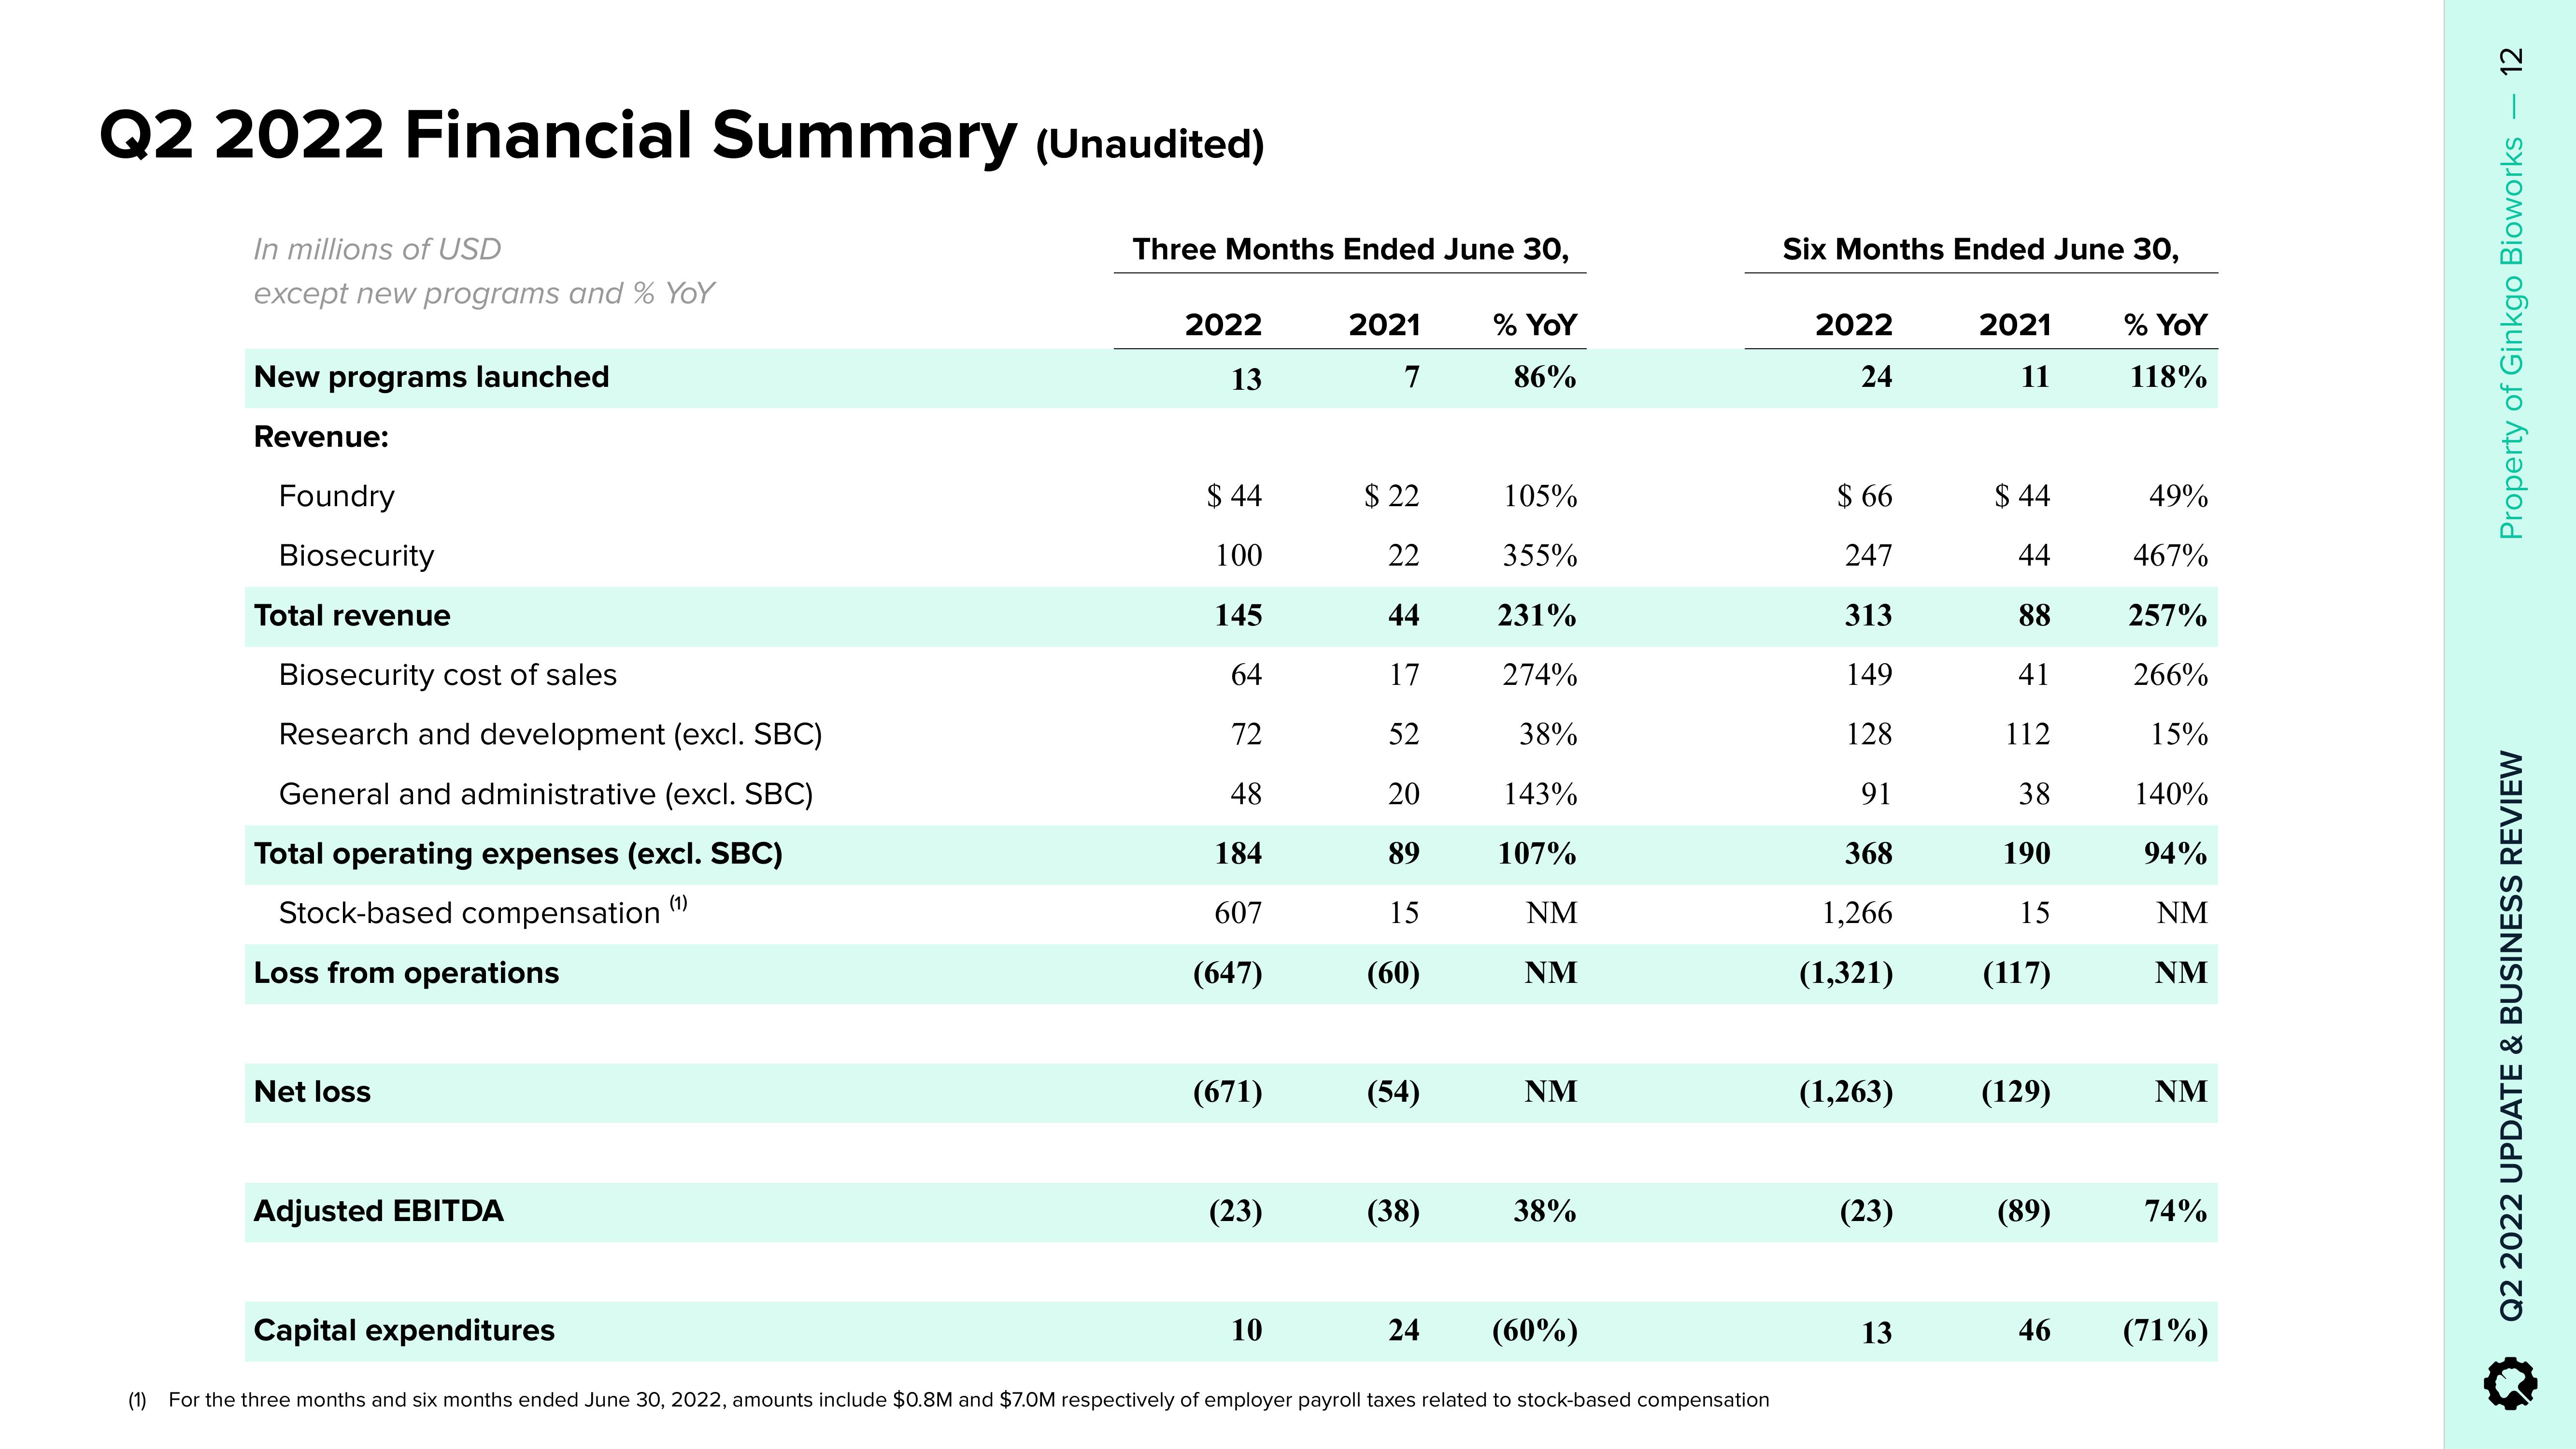
(1) For the three months and six months ended June 30, 2022, amounts include $0.8M and $7.0M respectively of employer payroll taxes related to stock-based compensation
Six Months Ended June 30,
2022
24
$ 66
247
313
149
128
91
368
1,266
(1,321)
(1,263)
(23)
13
2021
11
$44
44
88
41
112
38
190
15
(117)
(129)
(89)
46
% YoY
118%
49%
467%
257%
266%
15%
140%
94%
NM
NM
NM
74%
(71%)
12
Property of Ginkgo Bioworks
Q2 2022 UPDATE & BUSINESS REVIEWView entire presentation