Truist Financial Corp Results Presentation Deck
Consumer Banking & Wealth
Represents performance for Retail and Small Business Banking, Wealth, Mortgage Banking, Dealer Retail Services, and Consumer Finance
Income statement ($ MM)
Net interest income
Provision for credit losses
Noninterest income
Noninterest expense
Segment net income
Balance Sheet ($ B)
Average loans(¹)
Average deposits
Other Key Metrics
Mortgages serviced for others ($B)(²)
Wealth management AUM (SB)(2)
Branches
(1) Excludes loans held for sale
(2) Amount reported reflects end of period balance
Metrics
3Q22
$2,645
283
882
1,952
986
$140.3
249.5
$218.7
173.9
2,119
Linked Qtr.
Change
$368
84
(9)
1
210
$6.0
(5.6)
$9.2
(6.2)
2
Like Qtr.
Change
$495
288
(146)
(33)
53
$7.7
6.2
$20.6
(28.8)
(399)
-
Commentary
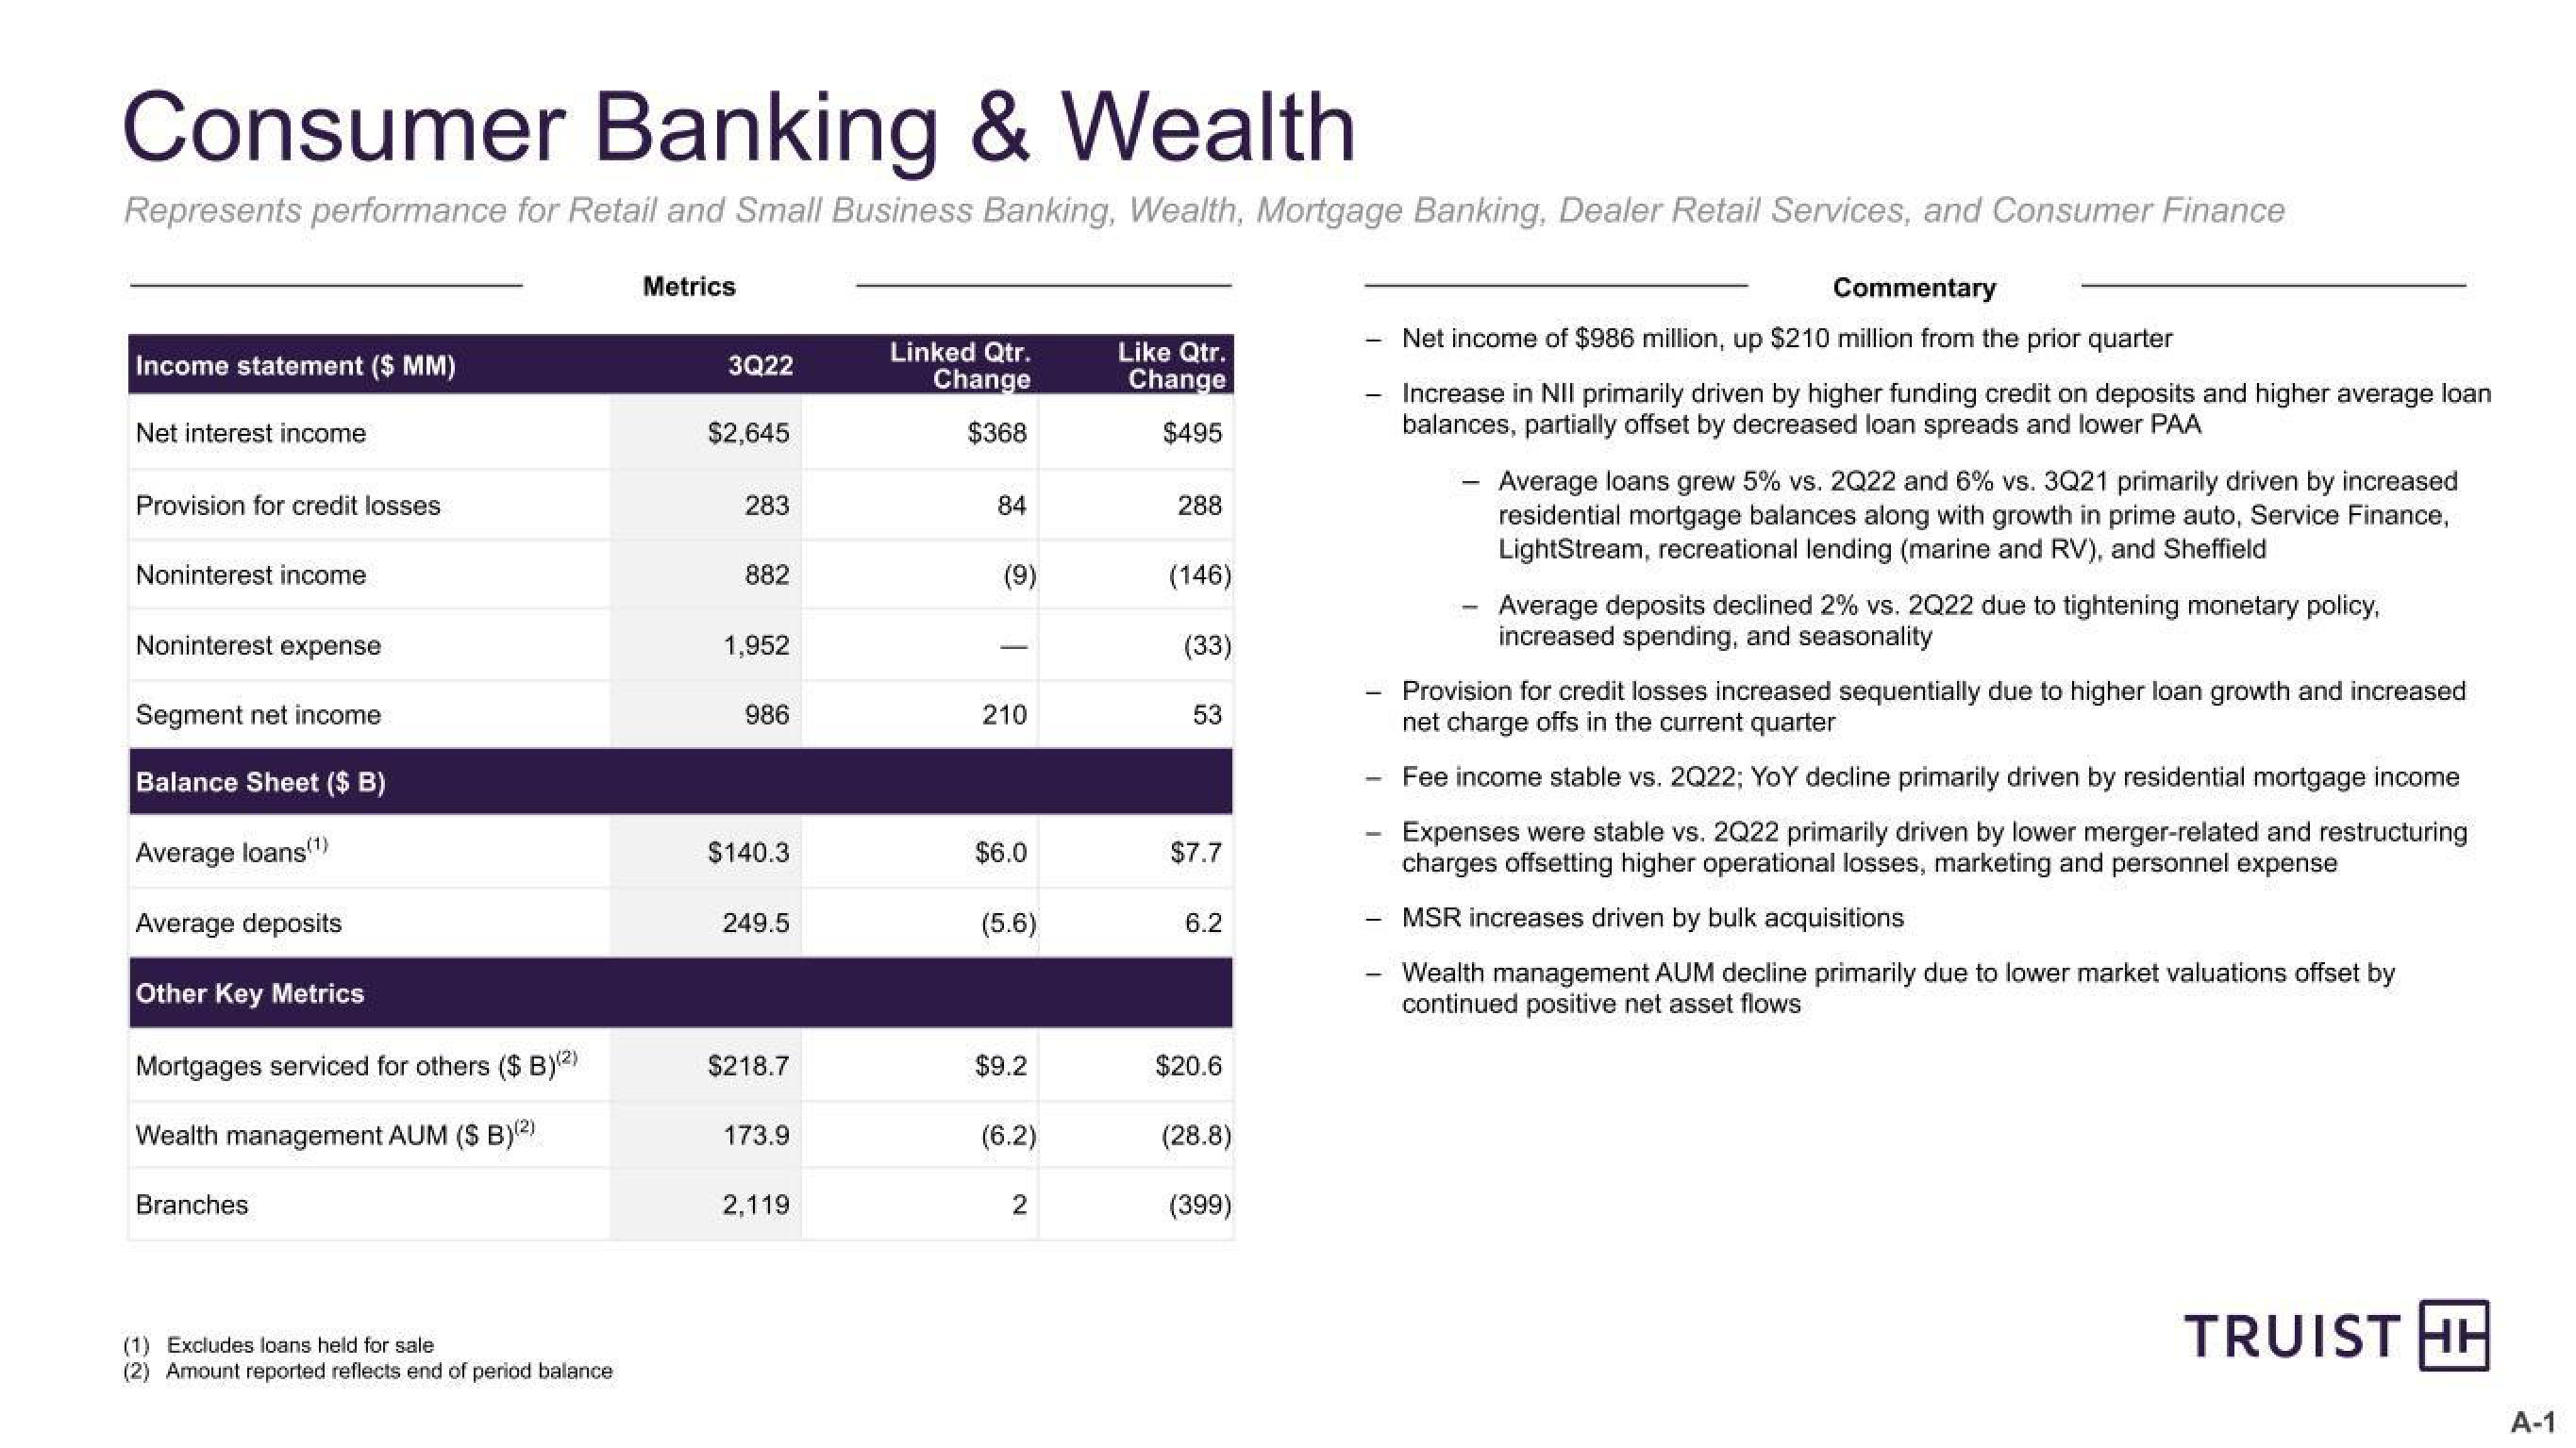
Net income of $986 million, up $210 million from the prior quarter
Increase in NII primarily driven by higher funding credit on deposits and higher average loan
balances, partially offset by decreased loan spreads and lower PAA
-
Average loans grew 5% vs. 2Q22 and 6% vs. 3Q21 primarily driven by increased
residential mortgage balances along with growth in prime auto, Service Finance,
LightStream, recreational lending (marine and RV), and Sheffield
Average deposits declined 2% vs. 2Q22 due to tightening monetary policy,
increased spending, and seasonality
Provision for credit losses increased sequentially due to higher loan growth and increased
net charge offs in the current quarter
Fee income stable vs. 2Q22; YoY decline primarily driven by residential mortgage income
Expenses were stable vs. 2Q22 primarily driven by lower merger-related and restructuring
charges offsetting higher operational losses, marketing and personnel expense
MSR increases driven by bulk acquisitions
Wealth management AUM decline primarily due to lower market valuations offset by
continued positive net asset flows
TRUIST HH
A-1View entire presentation